
Summary
Intelligence is becoming the most valuable thing an economy produces, and the machines that produce it are owned by a handful of companies. A community compute garden changes who owns them.
The model is community solar. A garden places an NVIDIA SuperPOD in a community center, business park, or campus, sells its output as model-as-a-service, and pays the members who own it. At Reflex’s modeled $800M a year in revenue, one garden produces $775M in net operating income to divide among its owners. For homes and business buildings that want to host hardware directly, the Air Node brings the same model to a single wall.
Key findings
- The most efficient GPUs return the most per owner. A garden SuperPOD earns about $400,000 a year per kilowatt, roughly 20 times what an Air Node earns renting on the spot market.
- Ownership scales to thousands of members. Split evenly across 10,000 members, a garden returns $77,500 a year per member before capital recovery.
- Hyperscale is being slowed by law, not by demand. New York now pauses permits for data centers over 20 MW; a 2 MW garden sits under every threshold.
- The capacity is already built. Homes, business parks, and campuses are wired for peaks they rarely reach, and flexible compute can use that margin.
The community compute garden
A garden is a SuperPOD owned by the people around it and operated by Reflex, in a building the community already has.
How a garden works
The host site is a community center, business park, college campus, or municipal building with high-capacity electrical service. Reflex installs and runs the cluster, sells its output as tokens through a model-as-a-service API, and pays the members after operating costs.
- HostCommunity siteCommunity center, business park, or campus
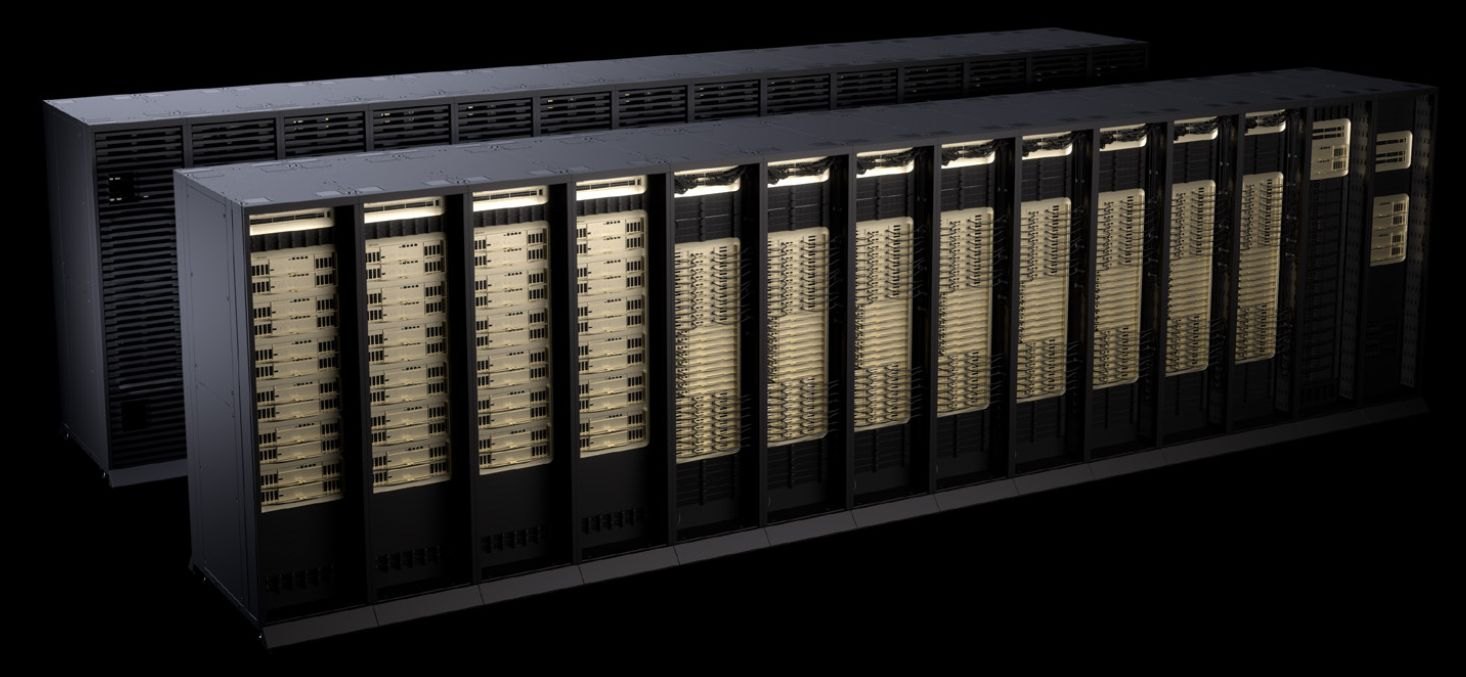
- Hardware576 GPUs8 × NVIDIA Vera Rubin NVL72
- ProductTokensModel-as-a-service, sold by the million
- Revenue$800MModeled, per year
- OwnersMembersNet income paid by share
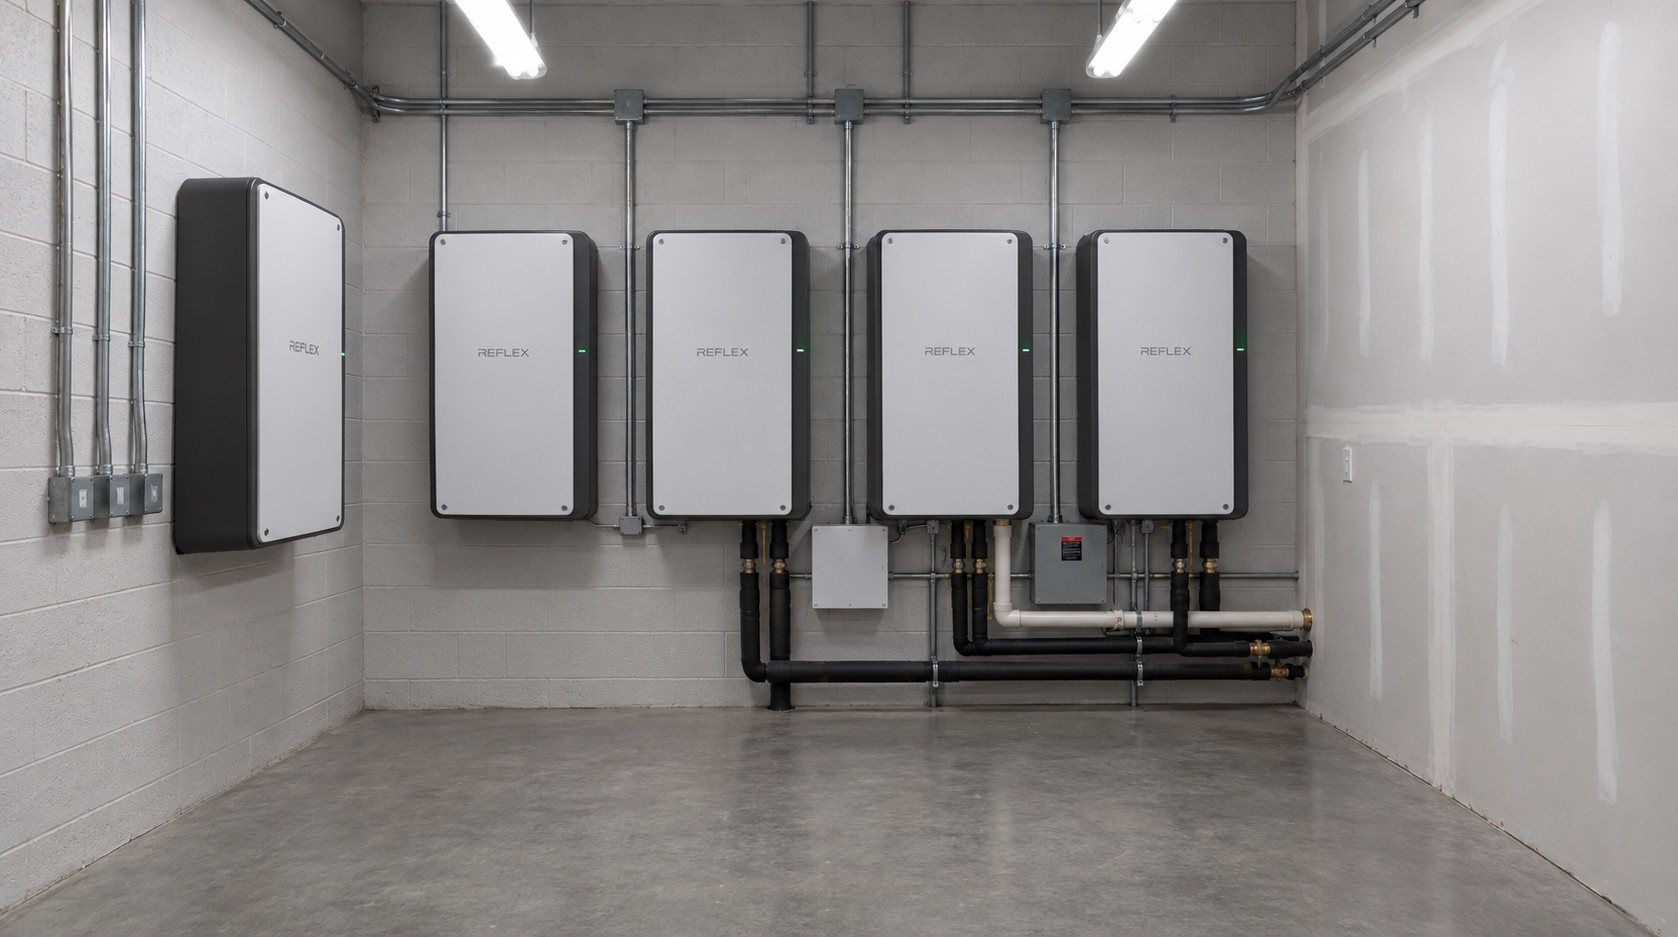
Smaller sites start with liquid-cooled nodes: sixteen RTX PRO 6000 GPUs per node, mounted in a plant room and plumbed to the building loop. They share the garden’s ownership model and grow into a full SuperPOD as membership grows.
What a garden earns
Reflex models one SuperPOD at $800M a year. At $4 per million tokens and 15,000tokens per GPU-second, the cluster’s full-year capacity is about $1.09 billion, so the model assumes about 73% of that capacity is sold. Operating costs are held to the $25M ceiling Reflex uses for a 2 MW site.
Table 1. Garden economics
| Line | Per year | Basis |
|---|---|---|
| Revenue | $800,000,000 | Model-as-a-service, 73% of full-year token capacity |
| Operating costs | $25,000,000 | Power, cooling, staff, network, insurance |
| Net operating income | $775,000,000 | Paid to members by share |
| Revenue per GPU | $1,388,889 | 576 GPUs |
| Revenue per kilowatt | $400,000 | 2,000 kW of IT load |
Before capital recovery, financing, and tax. Revenue is Reflex's modeled scenario, not a measured result.
What an owner earns
Members own the garden in shares. Every share earns the same return, so what a member receives depends only on how much of the garden they own. Table 2 shows what common slices earn; Figure 4 shows how net income divides as membership grows.
Table 2. Annual earnings by ownership slice
| Slice of the garden | Revenue | Net operating income |
|---|---|---|
| One rack | $100,000,000 | $96,875,000 |
| One GPU | $1,388,889 | $1,345,486 |
| A 0.01% share | $80,000 | $77,500 |
| A 0.001% share | $8,000 | $7,750 |
Net is revenue less operating costs, before capital recovery, financing, and tax.
Annual net per member
USD, equal shares
The return comes from the silicon. Vera Rubin GPUs sold as tokens earn far more per kilowatt than older GPUs rented by the hour, so a member who owns a share of a SuperPOD owns more earning power per dollar of electricity than a household running its own hardware.
Revenue per kW of IT power
USD per year
The solar template
Community-owned compute has no precedent, and it is the model Reflex is built around. Community solar provides the legal and financial template: New York’s Community Distributed Generation rules and the value stack already compensate distributed assets and lock terms for 25 years. Existing compute marketplaces such as Vast.ai, Salad, and io.net rent from individual hosts; none are shared ownership.
Waste heat
In a cold climate, a garden’s waste heat can warm the building that hosts it. Stockholm trades data center heat as a product, and New York is studying the same approach.
Table 3. Documented waste heat recovery
| Project | Result |
|---|---|
| Stockholm Exergi, Open District Heating | Waste heat sold into district heating at roughly SEK 2M per MW per year, across 30+ connected data centers |
| Meta, Odense, Denmark | Roughly 100,000 MWh per year of recovered heat delivered into the district network |
| NYSERDA, DATA HEAT study | New York-specific assessment of coupling data centers to district energy, published February 2026 |
Precedents, not Reflex results.
Why now
Demand
US data centers consumed roughly 183 TWh in 2024, more than 4% of national electricity, and the EIA projects 426 TWh by 2030. The IEA puts data centers at around 50% of US electricity demand growth through 2030, with global data center consumption up about 17% in 2025 alone.
Consumption
TWh per year
Where hyperscale is blocked
New York passed the Responsible Data Center Development Act in June 2026. The permit pause applies to data centers at or above 20 MW, while a separate article of the Energy Law applies at 5 MW and above, requiring renewable procurement on a schedule and directing the Public Service Commission to create separate rate classes so grid upgrades are not charged to residential customers.
Table 4. Selected restrictions on data center development
| Jurisdiction | Instrument | Threshold | Effect |
|---|---|---|---|
| New York State | Responsible Data Center Development Act (S10642 / A11560)Passed June 2026 | ≥ 20 MW | One-year pause on state environmental permits for large data centers |
| New York State | Energy Law Article 19Passed June 2026 | ≥ 5 MW | Renewable procurement targets (⅓ by 2030, ⅔ by 2035, 90% by 2040) and separate utility rate classes so grid upgrades are not socialized onto residential ratepayers |
| Loudoun County, Virginia | Zoning amendment, Phase 1March 2025 | All data centers | By-right approval removed; each project now needs a special exception and public hearings |
| Texas | Governor-ordered audit of grid-connecting data centersAugust 2026 | All grid-connecting projects | De facto statewide pause pending review; 100+ local ordinances considered since July 2025 |
| Mesa, Arizona | Ordinance 5957July 2025 | All data centers | Restricted to industrial zoning through a planned-area overlay requiring council approval |
Instruments as passed or adopted; thresholds are stated as written in each instrument.
New York does not cap data centers at 5 MW. Above 5 MW a project takes on renewable procurement and rate-class obligations; above 20 MW it cannot get a state environmental permit during the pause. A 2 MW garden sits under both.
The queue
Where permission exists, capacity does not. Dominion’s large-load queue holds roughly 70 GW of requests with about 25 GW assigned connection dates through 2031, and waits of around 7 years are reported for large campuses. In Texas more than 230 GW of large load is seeking interconnection, roughly 70% of it data centers.
ERCOT’s controllable load pathway lets flexible capacity connect ahead of firm load, in exchange for being curtailable. Inference can be curtailed.
The capacity already built
Homes, business parks, and campuses are wired for peaks they rarely reach. The average American home uses about 865 kWh a month, roughly 1.2 kW drawn continuously, from a service of typically 200 amps at 240 volts, about 48 kW. Even at a household peak of 19–36 kW, most of that capacity is unused.
Capacity and draw
kW per household
Utilities size distribution transformers to coincident peak rather than the sum of connected loads, because buildings do not peak together. That margin exists today and needs no new transmission. Con Edison and the other New York utilities publish hosting capacity maps showing where it is.
Compute can use that margin without threatening it, because inference can be paused. Figure 8 shows one transformer over a day. A compute load set below the operating limit runs at full power for most of the day and steps down only during the evening peak, delivering about 89% of the energy it would draw running flat out.
The Air Node
The Air Node is for owners who want hardware on their own wall: a home, a shop, or an office building.
The product
Sixteen L4-class GPUs in a sealed, air-cooled enclosure, quiet enough for an occupied floor and small enough to run on a building’s existing electrical service. At 72 W per GPU the silicon accounts for about 1152 W, which reconciles with the 1.4 kW figure for the whole chassis.
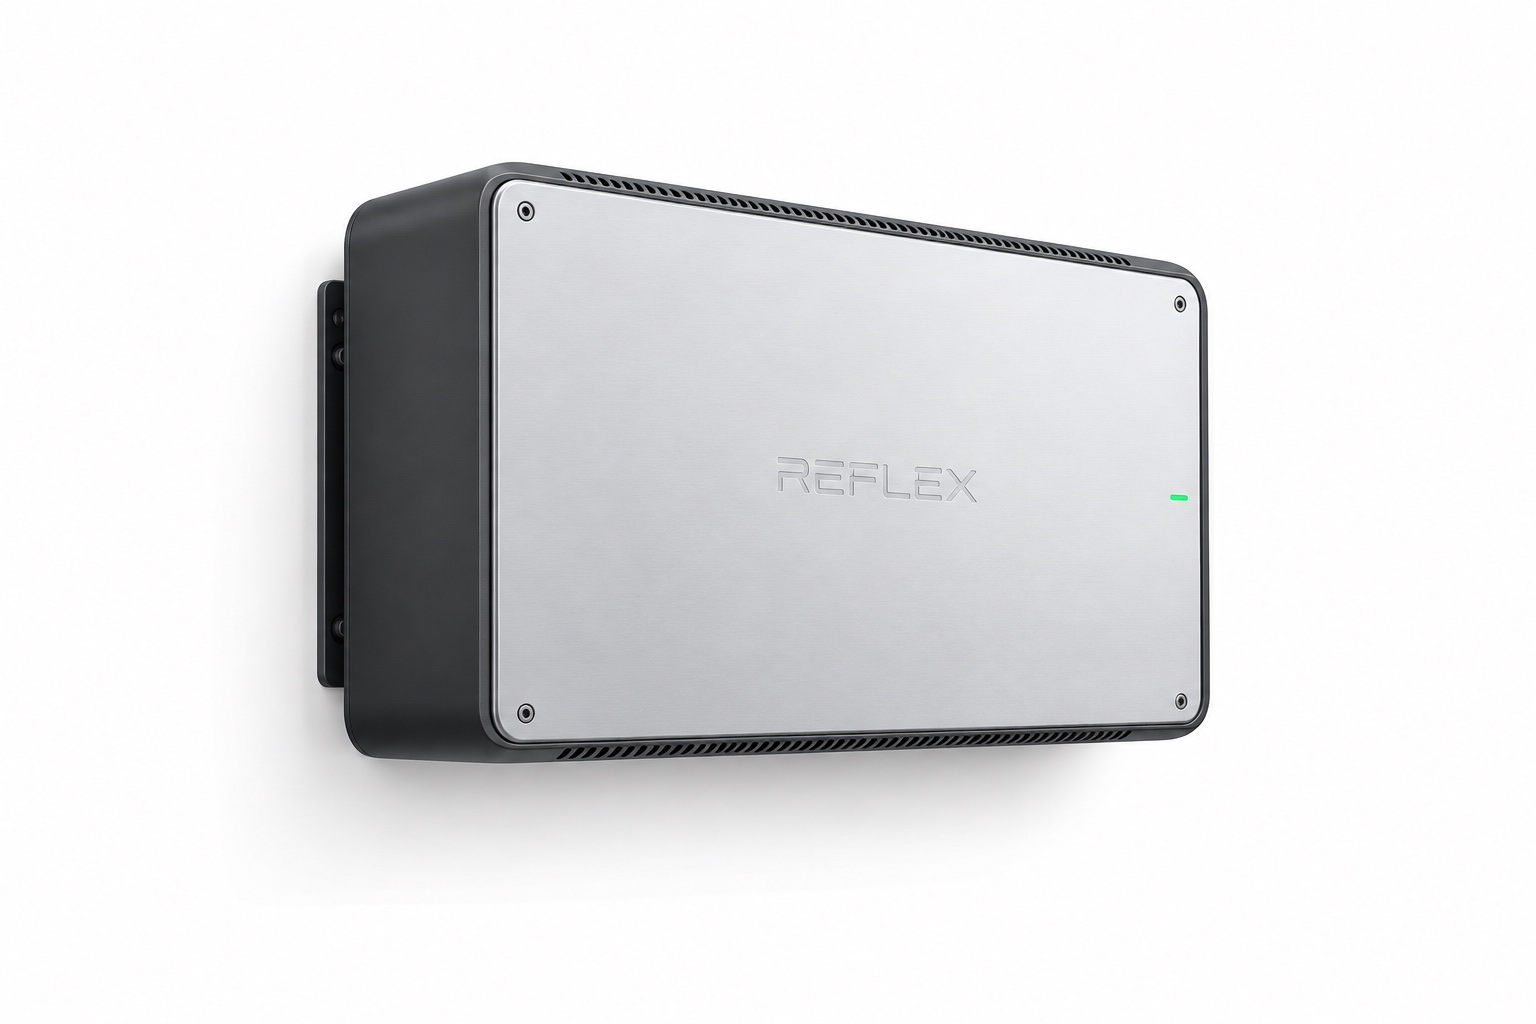
Table 5. Where each product fits
| Product | Placement | Silicon | Power | Workload |
|---|---|---|---|---|
| Garden SuperPOD | Community center, business park, or campus | 8 × Vera Rubin NVL72, 576 GPUs | ~2 MW | Model-as-a-service at scale |
| Liquid node | Plant room of a community or commercial building | 16 × RTX PRO 6000 | ~12 kW | Inference, fine-tuning |
| Air Node | A wall in a home or business building | 16 × L4 class | ~1.4 kW | Inference |
What a node earns
At the marketplace rate observed for L4 capacity in September 2026, roughly $0.20 per GPU-hour, sixteen GPUs rented every hour of the year gross about $28,032. Marketplace utilization is well below full and no operator publishes an average, so revenue is shown across a range.
Annual gross revenue
USD, before power and hardware
A node running continuously uses 12,264 kWh a year, which at New York residential rates costs $3,360 to $3,667. Power alone needs roughly 14% average utilization before the node earns anything. Contracted capacity at enterprise rates, or routing the node into the garden’s model-as-a-service traffic, is what moves an Air Node well above the spot-market curve.
Who owns intelligence
The top tenth of American households holds 67.2% of household wealth; the bottom half holds 2.5%. Around 37% of households under 35 own a home, and their median net worth is about $39,000. Just over half of families hold any equities at all.
Wealth distribution
Percent of household wealth
If the output of AI accrues only to the companies that own data centers, that split widens. A garden lets a teacher, a shop owner, and a retiree hold a share of the same class of hardware the largest labs run, in a building they already use, and be paid from what it produces.
Notices & references
Forward-looking statements
This paper contains projections of revenue, cost, and program structure that depend on utility agreements, hardware pricing, market rates, and regulatory outcomes that may not hold. Garden revenue is a modeled scenario. Earnings shown per member or per share exclude capital recovery, financing, and tax. Nothing here is an offer to sell or a solicitation to buy any security or ownership interest.
On the evidence
The New York thresholds are stated as written in the legislation rather than as summarized in trade press. No published average utilization figure exists for decentralized GPU hosting, so Air Node utilization is presented as a range.
Trademarks
NVIDIA, DGX, Vera Rubin, RTX, and L4 are trademarks of NVIDIA Corporation. All other company names are trademarks of their respective owners and are used for identification only.
Image credits
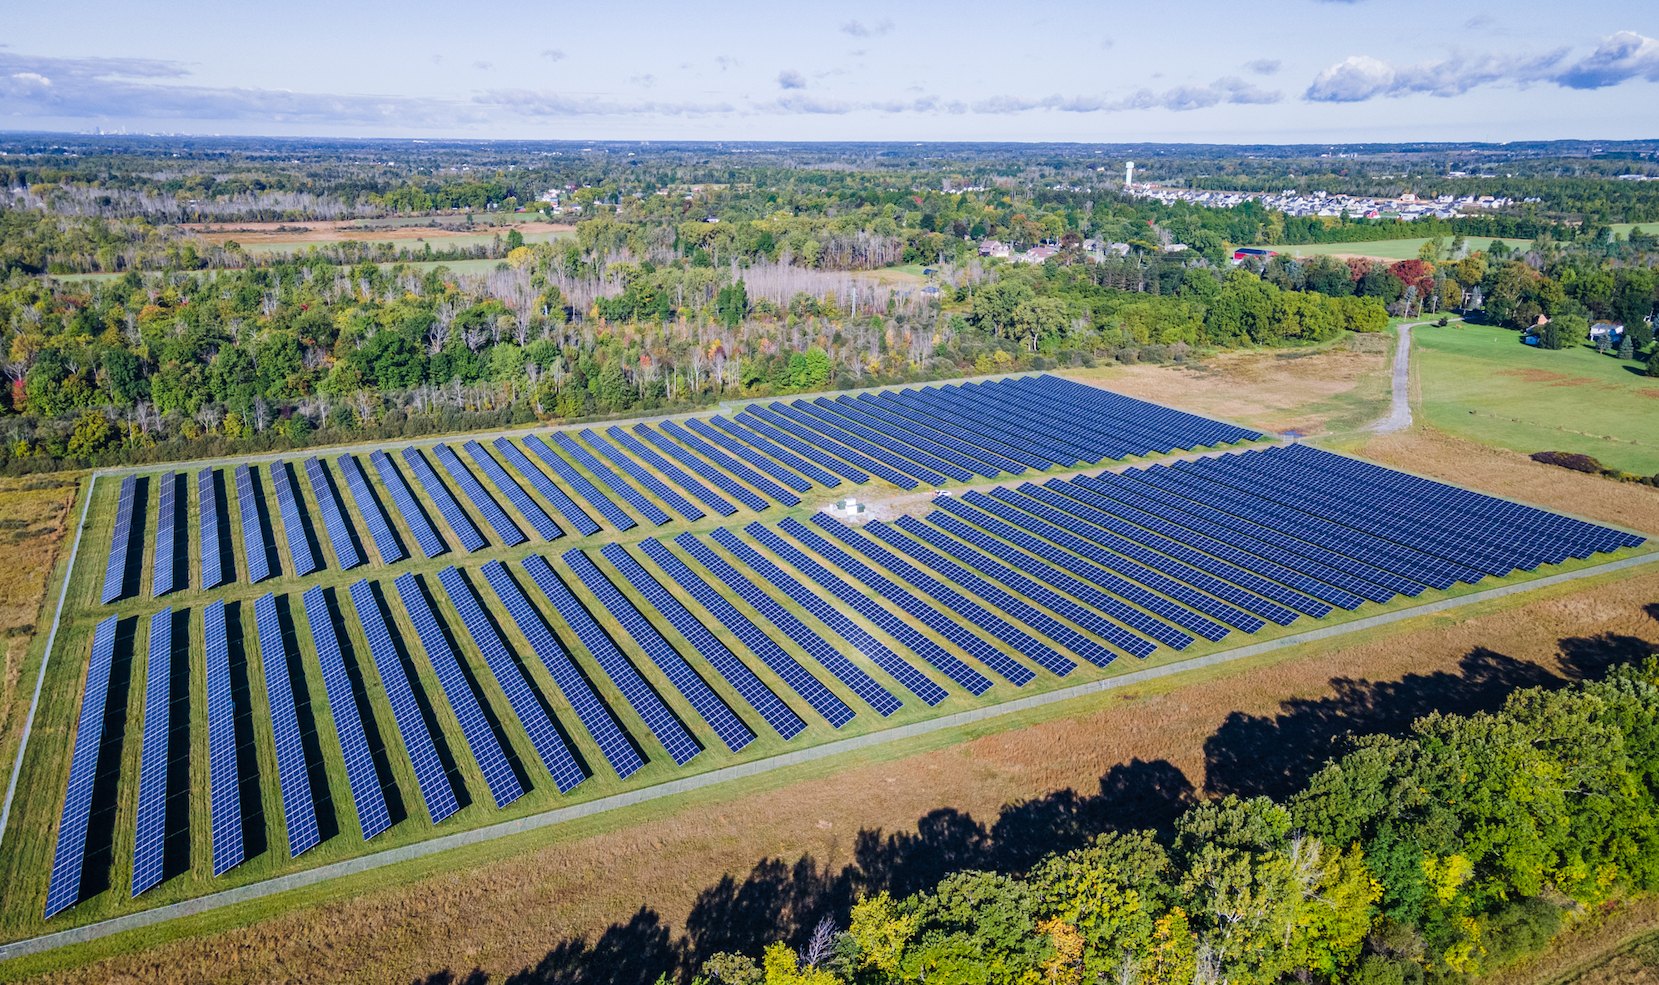
Cover: Nexamp community solar farm in Lockport, New York, photograph by ItaliaCalcio2008, CC BY-SA 4.0, via Wikimedia Commons. Vera Rubin NVL72: NVIDIA Corporation.
References
- New York State Senate, Responsible Data Center Development Act (S10642 / A11560) (Passed June 2026). www.nysenate.gov/legislation/bills/2025/S10642
- US Energy Information Administration, US data center electricity consumption (2025). www.eia.gov/todayinenergy/detail.php?id=67704
- International Energy Agency, Electricity 2026: Demand (2026). www.iea.org/reports/electricity-2026/demand
- ERCOT, Large Load Interconnection and Provisional Controllable Load Resources (2025). www.ercot.com/services/rq/large-load-integration
- US Energy Information Administration, How much electricity does an American home use? (FAQ 97) (2024). www.eia.gov/tools/faqs/faq.php?id=97&t=3
- Con Edison, Hosting Capacity Map (accessed September 2026). www.coned.com/en/business-partners/hosting-capacity
- NYSERDA, Value of Distributed Energy Resources (VDER) and Community Distributed Generation (accessed September 2026). www.nyserda.ny.gov/vder
- NVIDIA, NVIDIA L4 Tensor Core GPU datasheet (accessed September 2026). resources.nvidia.com/en-us-gpu-resources/l4-tensor-datasheet
- Vast.ai, L4 GPU rental pricing (captured September 2026). vast.ai/pricing/gpu/L4
- Eurelectric / Stockholm Exergi, Open District Heating: data center waste heat as a tradable product (2022). www.eurelectric.org/stories/stockholm-exergi-data-parks-shows-the-potential-for-scaling-the-reuse-of-waste-heat-when-it-becomes-a-tradable-product/
- NYSERDA, DATA HEAT: Sector Coupling of Data Centers and District Energy (February 2026). www.nyserda.ny.gov/-/media/Project/Nyserda/Files/Programs/Large-Scale-Thermal/DATA-HEAT---Sector-Coupling-Data-Centers-and-District-Energy.pdf
- Federal Reserve, Distributional Financial Accounts (Q4 2024). www.federalreserve.gov/releases/efa/efa-distributional-financial-accounts.htm
- Kosowski et al., Pathway (arXiv:2509.26507), The Dragon Hatchling: The Missing Link between the Transformer and Models of the Brain (September 2025). arxiv.org/abs/2509.26507
- Trade press summary, Dominion large-load interconnection queue reporting (2026). enkiai.com/data-center/dominion-energy-nuclear-pjm-queue/