
Summary
Cortex is Reflex’s program to build, operate, and monetize modular 2 MW NVIDIA DGX SuperPOD installations in African metros where generation capacity, subsea fibre, and enterprise demand already meet. The first deployment retrofits a warehouse in Ota Industrial Estate, in the Lagos–Ogun metro, and brings eight DGX Vera Rubin NVL72 racks, 576 GPUs in total, into commercial operation.
The facility’s product is tokens. Reflex sells inference through its own model-as-a-service layer at $4.00 per million tokens and backfills idle capacity as bare-metal cloud at $5.00 per GPU-hour. Under the utilization ramp modeled in the revenue projections, the site produces $584.2M of Year 1 revenue against an operating cost ceiling of $25.0M.
Key findings
- Power is the binding constraint on AI capacity. The ten target sites sit beside more than 3.6 GW of generation, most within three miles of carrier fibre.
- Tokens outperform rental by 43×. One GPU-hour sold as inference returns $216.00; the same hour rented as bare metal returns $5.00.
- Existing shells shorten time to power. Retrofitting a warehouse avoids greenfield construction.
- Local crews run the site. Reflex trains and certifies technicians and engineers in-country, with 44 direct operating roles in Year 1.
Sites
A viable site must be able to power a SuperPOD today and sell its output to buyers within reach of the same fibre.
Selection criteria
Reflex evaluated candidate interconnects across the continent against six factors spanning network, business, and power.
- PowerMW at the interconnect
- Sets the ceiling for expansion beyond the first 2 MW block.
- Fibremiles to carrier route
- Drives latency, backhaul cost, and time to cross-connect.
- Banking$bn metro bank assets
- A proxy for high-compliance enterprise and sovereign demand.
- BPO$m outsourcing market
- Near-term demand for customer service and document agents.
- SubscribersM mobile subscribers
- Sizes consumer-facing inference volume in the market.
- Buyer networksreachable enterprise buyers
- Indicates how quickly enterprise sales cycles close.
Target metros
Ten metros meet the criteria, spanning West, North, East, and Southern Africa. Lagos–Ogun is the first deployment and the subject of the case study that follows. Select a metro to see its site.
 Imagery: NASA Blue Marble
Site 01
Olorunsogo II
Lagos–Ogun, Nigeria
6.87° N · 3.23° E
- Adjacent generation
- 754 MW
- Distance to fibre
- 3.0 mi
Case study: Ota Industrial Estate, Lagos–Ogun
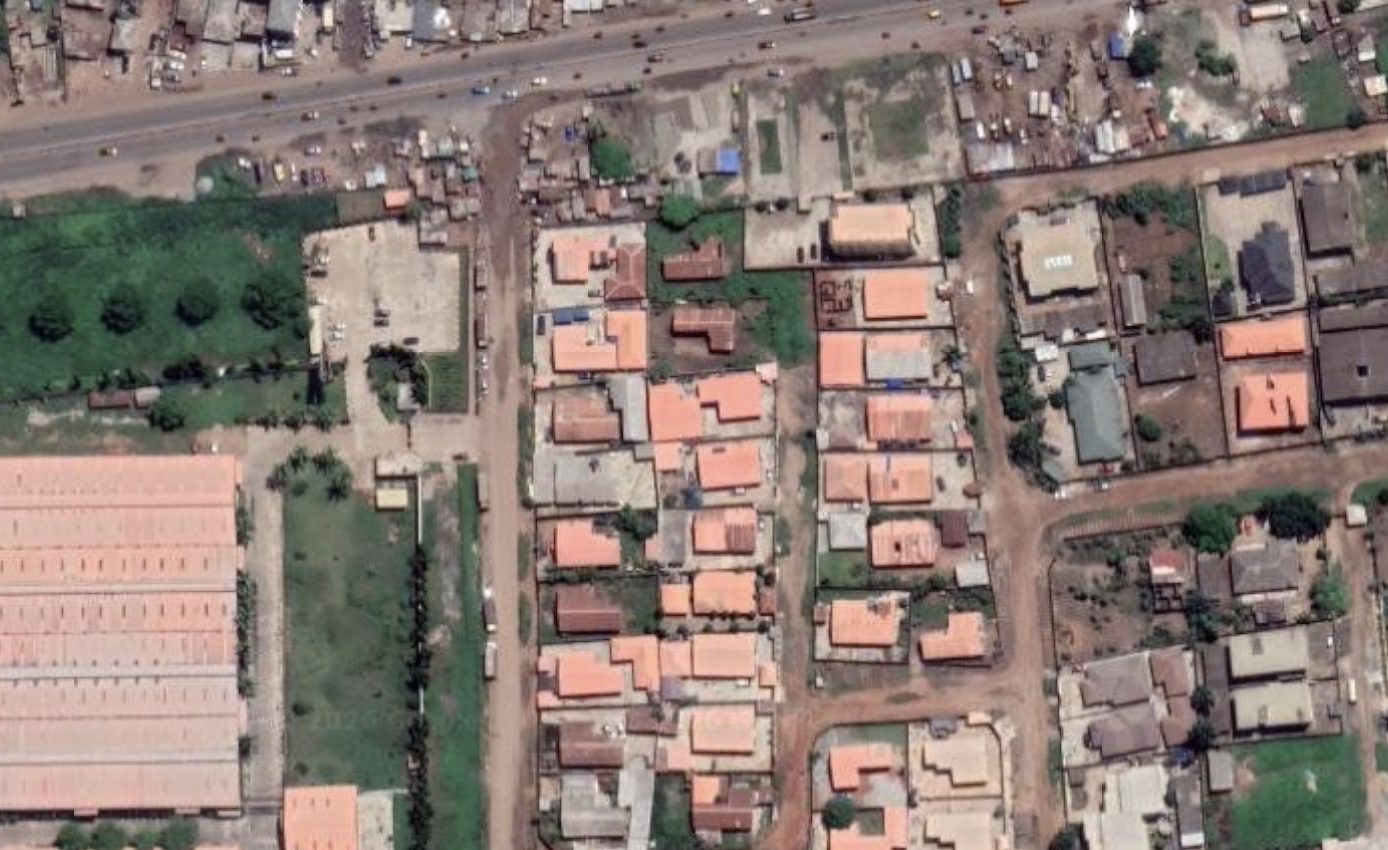
The first Cortex installation converts an existing warehouse in Ota Industrial Estate into a 2 MW SuperPOD, in the same Ogun industrial corridor as the 754 MW Olorunsogo II power station.
Ota Industrial Estate site
The building sits in Ota Industrial Estate, Ado-Odo/Ota LGA, Ogun State. It is a steel-framed warehouse with a clear-span interior, roller-shutter bays, and open yard space around the shell (Figures 2 and 3). The plan retrofits it rather than building new: slab reinforcement for rack loads, a mechanical yard for dry coolers, and a secured electrical room at the utility connection. Carrier fibre that reaches the Lagos subsea landing stations runs within 3.0 mi.
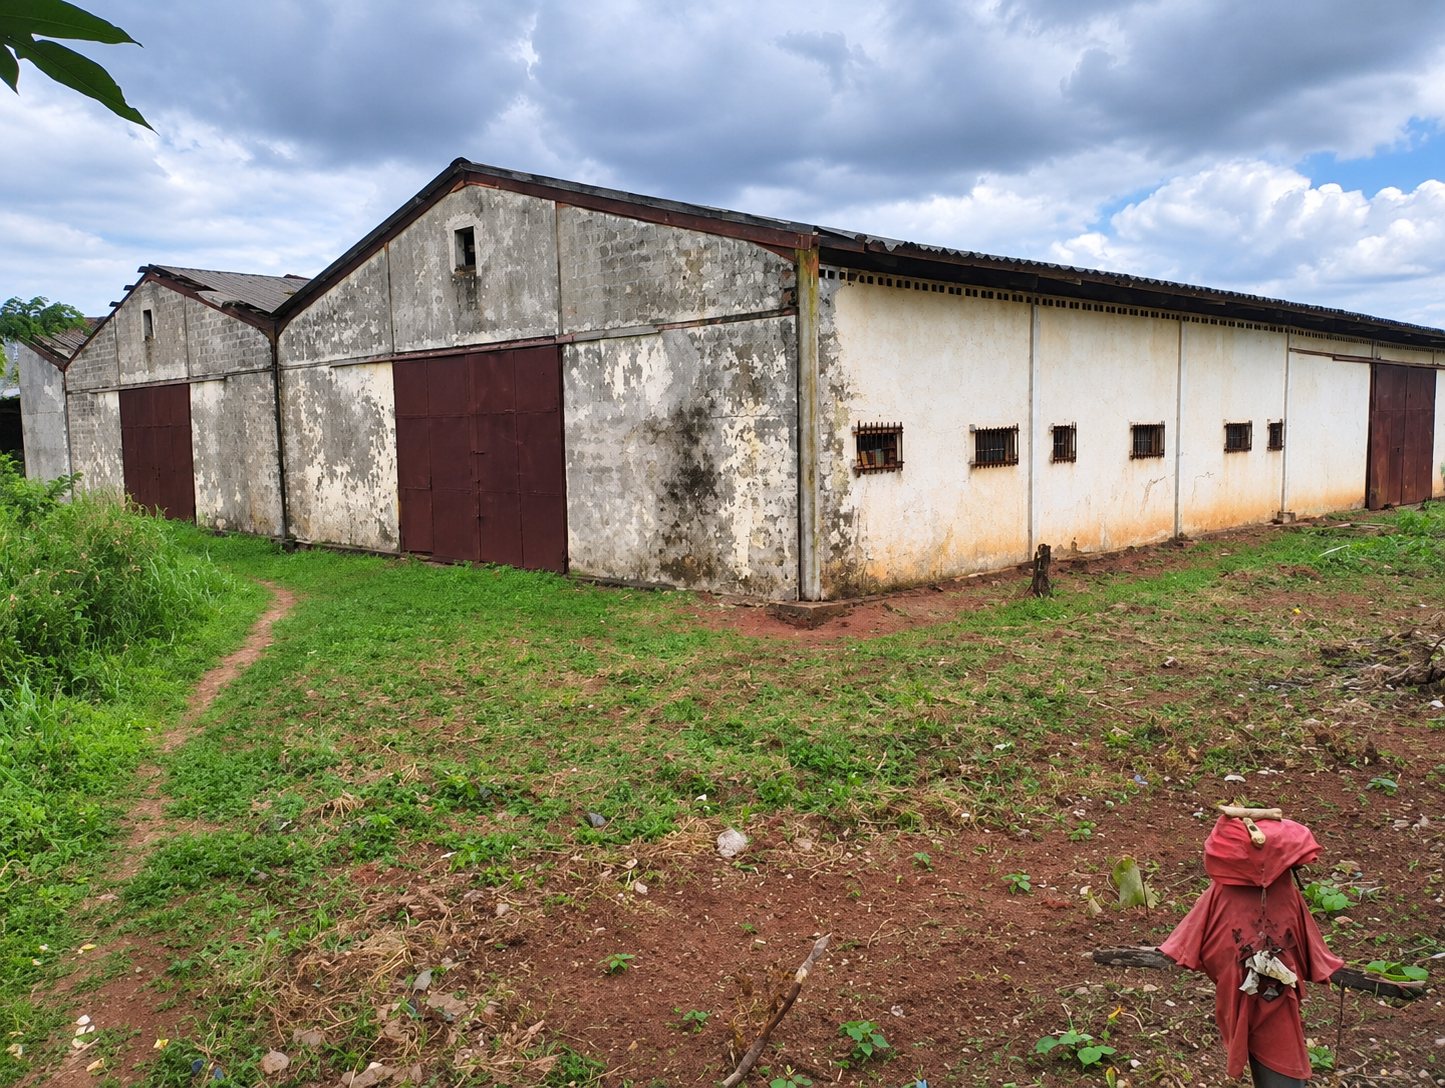 Exterior
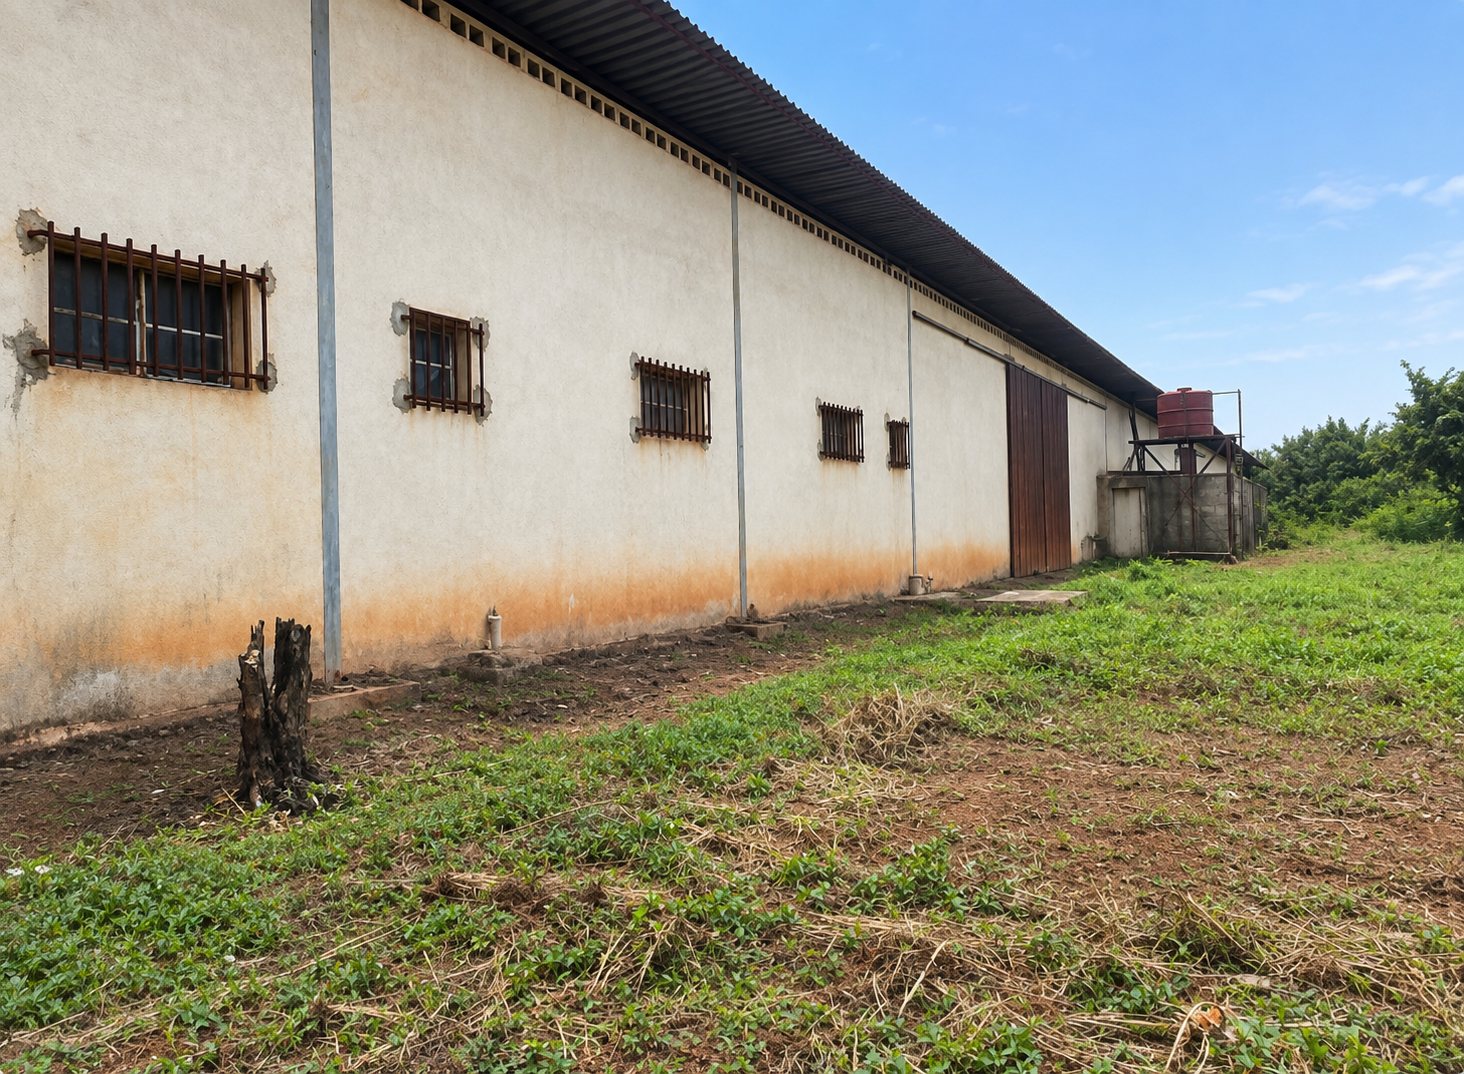 Side elevation
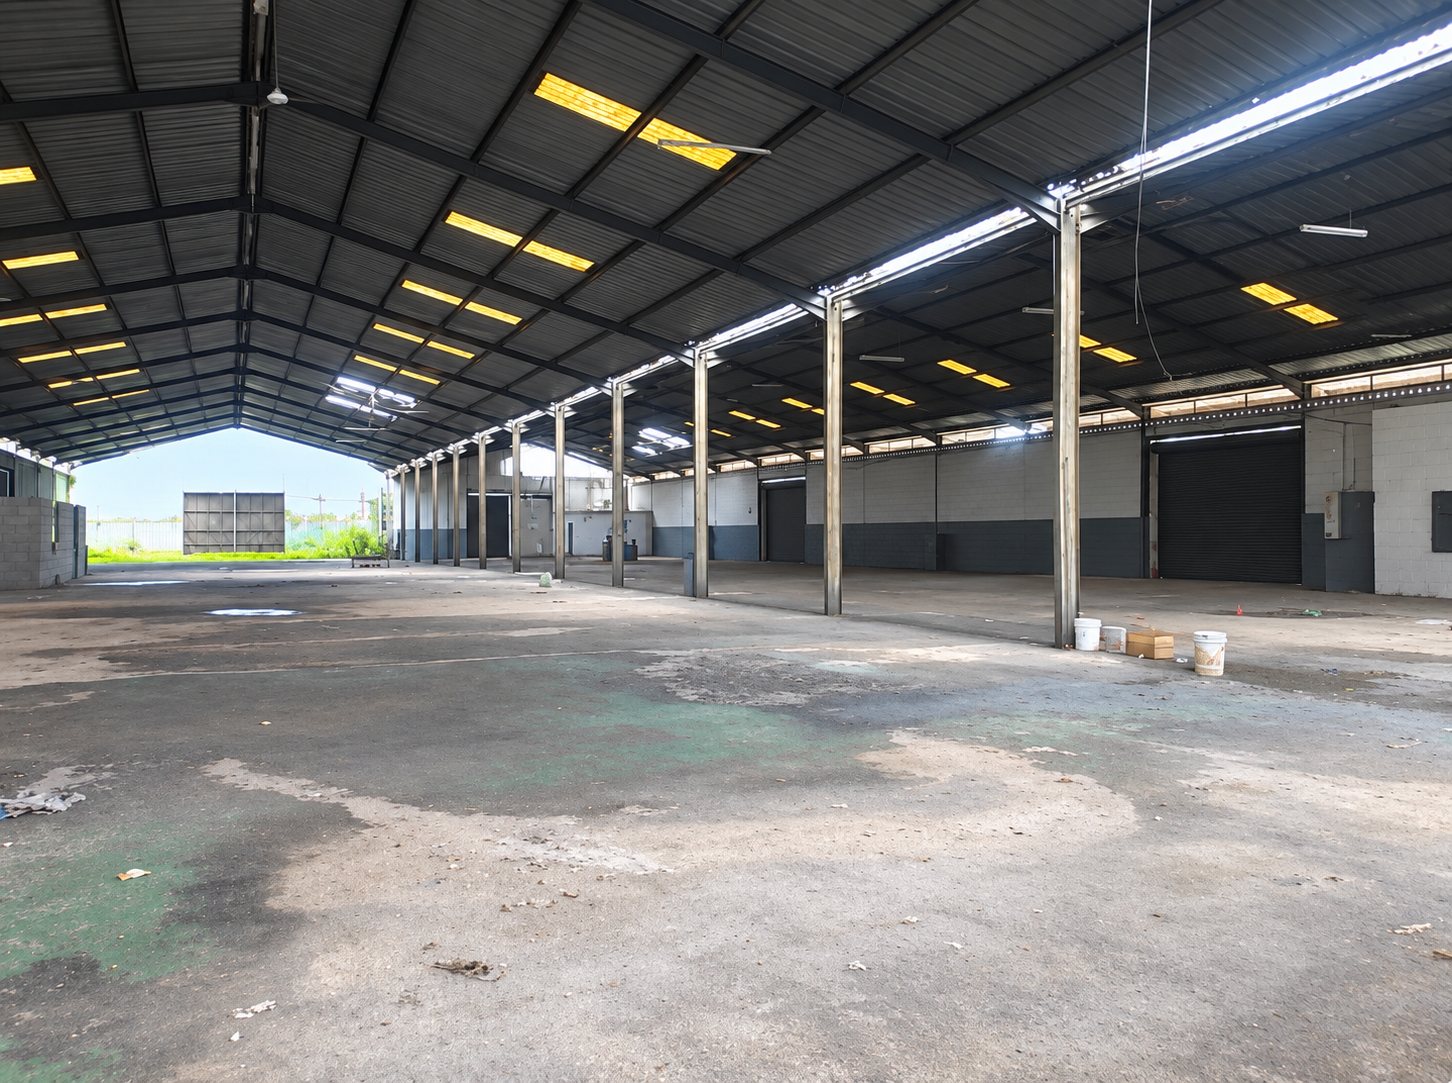 Interior
Project timeline
Twelve months separate notice to proceed from commercial operation, and the schedule has little slack. Transformers, switchgear, and cooling plant are ordered in the second month because they take the longest to arrive; power, permits, and shell work run in parallel so that the building is ready when racks ship in month nine.
Stakeholders
Table 1. Stakeholder organizations and roles
| Organization | Role |
|---|---|
| Reflex Technologies | Project sponsor, developer & operator |
| Mark III Systems | NVIDIA partner, cluster design, deployment & cloud stack |
| NVIDIA | DGX SuperPOD platform, reference architecture & support |
| Olorunsogo II Power Station | Primary power offtake |
| Ogun State Government | Permitting, land use & investment incentives |
| Carrier partner (to be selected) | Metro fibre backhaul to Lagos landing stations |
| EPC contractor (to be selected) | Shell retrofit, electrical & mechanical plant |
Installation
Reflex will partner with Mark III Systems to design, build, and bring up the cluster and its cloud software stack. Mark III is an NVIDIA partner focused on enterprise AI factories: it sizes, cables, and operates DGX SuperPOD infrastructure, and supported the SuperPOD behind Bristol Myers Squibb’s AI Center of Excellence.
- Design. Rack-scale layout, power, and cooling budgets against the NVIDIA DGX SuperPOD reference architecture.
- Integration. Rack placement, compute and storage fabric cabling, and liquid-cooling hookup.
- Cloud stack. Cluster management, Slurm and Kubernetes scheduling, and multi-tenant isolation for the IaaS and sovereign tenant lines.
- Acceptance. Burn-in, performance validation, and handover to Reflex operations alongside the local crew certification program.
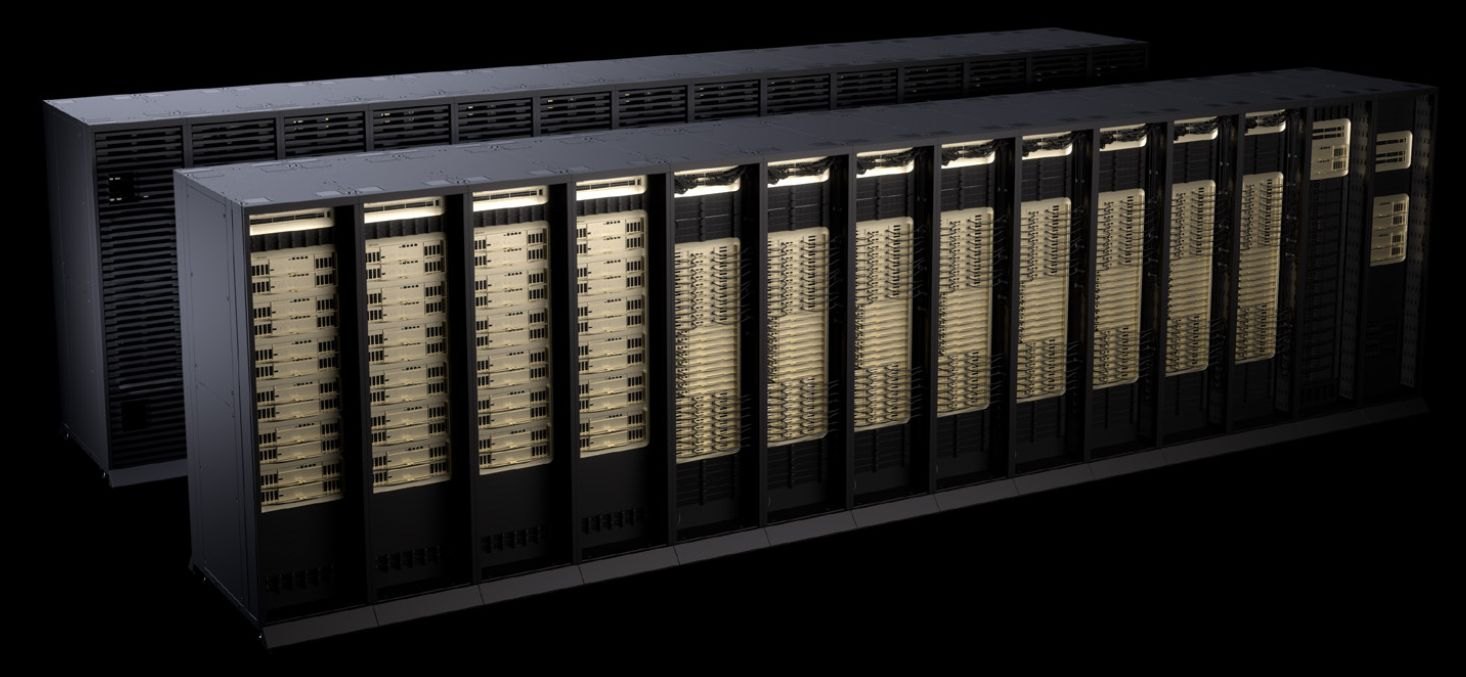
Rack anatomy
Every NVL72 rack is a self-contained system. Compute trays sit above and below the NVLink switch trays that join them, with power shelves at the top and bottom of the rack.
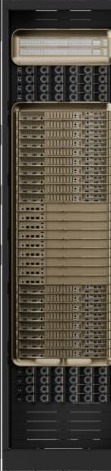
From top to bottom
- Top-of-rack management switches2
- Power shelves4
- Compute trays10
- NVLink switch trays9
- Compute trays8
- Power shelves4
Per rack: 72 GPUs and 36 CPUs in one NVLink domain.
Facility hookups
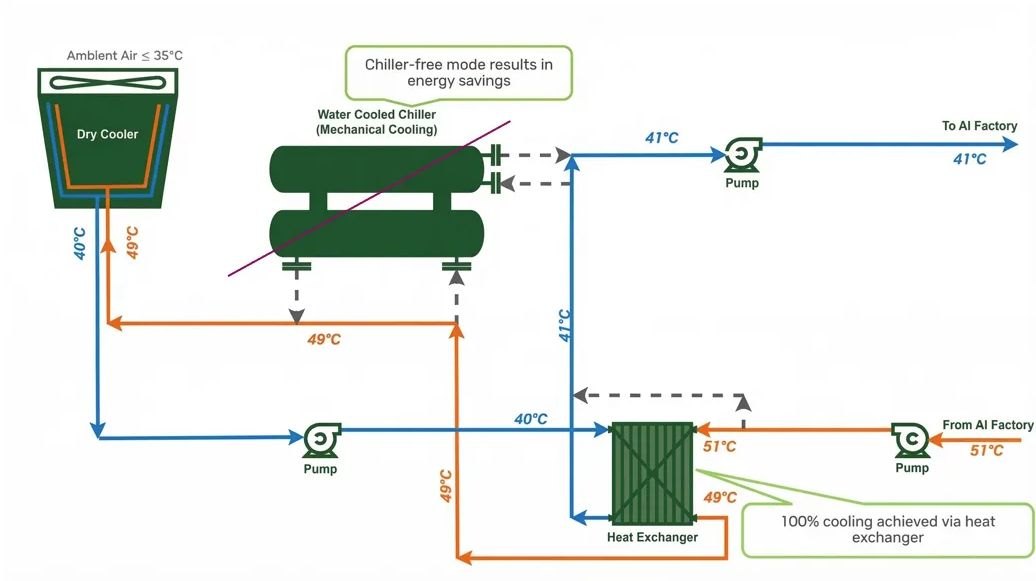
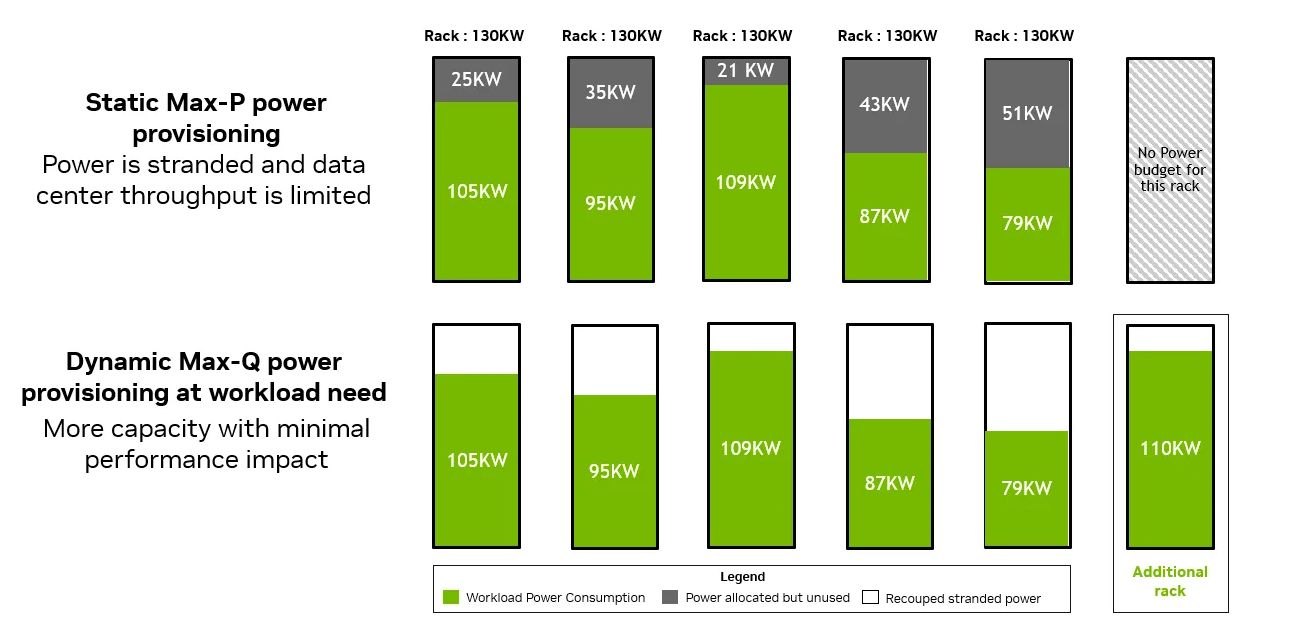
Three utilities enter the data hall: power from the utility connection, warm-water cooling from a chiller-free dry cooler plant, and network from the Lagos subsea landings. Each path is built with redundancy from the utility boundary to the rack.
Lagos–Ogun ambient temperatures rarely exceed 35 °C, which lets the cooling plant reject heat through dry coolers and a heat exchanger without mechanical chillers for most of the year (Figure 8). Dynamic power provisioning then lets the site place more rack capacity inside the same utility envelope (Figure 9).
The product is tokens
Most data centers sell capacity: a rack, a server, or an hour of GPU time. The customer pays for that time whether or not it produces anything. Cortex sells the output instead. Every request to the Cortex API, whether a support conversation, a contract review, or an agent completing a task, is measured in tokens, the small units of text a model reads and writes, and billed at $4.00 per million.
What makes that profitable is how Cortex runs its models. A conventional model is dense: to produce every single token, the GPU computes the entire network, every one of its billions of parameters. Cortex uses a sparse execution layer that activates only about 5% of the network for each token, the part relevant to that request, and skips the rest (Figure 10). The GPU does roughly a twentieth of the arithmetic per token, so the same hardware and the same megawatts produce far more tokens, and racks serving this traffic draw 15–20% less power.
Conventional dense modelEvery parameter runs for every token
100%Cortex sparse executionOnly the part relevant to the request runs
5%- Power2 MWCritical IT load
- Compute576 GPUs8 × Vera Rubin NVL72
- Execution5% activeShare of the model computed per token
- Output746B tokensPer day at full allocation
- Price$4.00Per million tokens
The revenue model assumes each GPU sustains 15,000 tokens per second. At that rate one GPU produces 54 million tokens an hour, worth $216.00. Rented out as raw hardware, the same GPU-hour earns $5.00, 43 times less.
Revenue per GPU-hour
USD · same hardware, two ways to sell it
Reflex’s commercial priority is onboarding enterprise API clients. IaaS fills idle capacity while MaaS demand ramps.
Business model
Cortex monetizes one physical cluster three ways, stacked so that every GPU-hour is sold at the highest-margin layer with demand for it.
Three-layer stack
Reflex’s middleware layer slices the cluster dynamically and routes kernels so that MaaS traffic, dedicated tenants, and bare-metal jobs share the same hardware without contending for it.
Running on one NVIDIA DGX SuperPOD: 8 × Vera Rubin NVL72, 576 GPUs
Service lines
- 01
Model-as-a-ServiceMaaS
Hosted model endpoints that customers call over an API, with no servers to manage. Sparse execution computes about 5% of the model per token, so Cortex can price inference well below dense-model APIs.
- Buyers
- Application developers and enterprises calling an API
- Pricing
- Per million tokens generated, or per automated agent task completed
- 02
Infrastructure-as-a-ServiceIaaS
GPU capacity rented by the hour or leased by the month, as bare metal or through a scheduler. Customers get liquid-cooled DGX SuperPOD capacity on NVLink without throttling, and Cortex fills GPUs that MaaS is not using.
- Buyers
- AI teams training or fine-tuning their own models
- Pricing
- Per GPU-hour, or monthly and annual dedicated cluster leases
- 03
Dedicated Compute / Sovereign Tenant CloudCCaaS
A dedicated, isolated slice of the cluster reserved for a single organization. Partitioning at the hardware level gives regulated customers private data center compliance without building one.
- Buyers
- Governments, hospital networks, and banks
- Pricing
- Flat-rate monthly virtual data center subscription
Revenue & cost projections
Year 1 combines a MaaS ramp from 20% to 80% of the cluster with IaaS backfill of the remainder. MaaS carries 97.9% of revenue.
Year 1 revenue
Twenty percent of the cluster processing MaaS tokens in Q1 earns $54.5M, more than ten times the $5.0M earned by the other 80% on hourly rental. Revenue therefore tracks the pace of enterprise API onboarding far more than total utilization.
Revenue by quarter
Year 1 · USD
Cluster allocation
Share of GPU capacity by quarter
Table 2. Year 1 revenue by quarter
| Quarter | MaaS share | MaaS revenue | IaaS share | IaaS revenue | Combined |
|---|---|---|---|---|---|
| Q1 | 20% | $54,494,208.00 | 80% | $5,045,760.00 | $59,539,968.00 |
| Q2 | 45% | $122,611,968.00 | 55% | $3,468,960.00 | $126,080,928.00 |
| Q3 | 65% | $177,106,176.00 | 35% | $2,207,520.00 | $179,313,696.00 |
| Q4 | 80% | $217,976,832.00 | 20% | $1,261,440.00 | $219,238,272.00 |
| Year 1 | $572,189,184.00 | $11,983,680.00 | $584,172,864.00 |
Table 3. Model assumptions
| Assumption | Value | Basis |
|---|---|---|
| GPUs in service | 576 | 8 racks × 72 GPUs |
| Hours per quarter | 2,190 | 8,760 hours ÷ 4 |
| MaaS price | $4.00 | Per million tokens generated |
| IaaS price | $5.00 | Per GPU-hour, baseline market rate for unused slices |
| Sustained throughput | 15,000 | Tokens per GPU-second, implied by the MaaS revenue line |
| Sell-through | 100% | All allocated capacity is billed |
Sensitivity. Because MaaS carries nearly all revenue, the projection is most sensitive to sustained throughput and sell-through. At half the modeled throughput, Year 1 revenue falls to $298.1M.
Operating costs
Year 1 operating costs fall into three buckets totaling $16.5M to $24.0M; the model uses a $25.0M ceiling.
Table 4. Year 1 operating cost matrix
| Cost bucket | Scope | Low | High |
|---|---|---|---|
| Power & liquid cooling | Utility offtake, CDU and dry-cooler operation, backup generation fuel | $8.0M | $12.0M |
| Software infrastructure & API routing | Ingress and egress transit, firewalls, token metering, compliance logging | $3.5M | $5.0M |
| Systems engineering payroll | Triton, CUDA, and kernel optimization engineers; on-site operations leads | $5.0M | $7.0M |
| Total | Ceiling used in model: $25.0M | $16.5M | $24.0M |
Excludes hardware capex, depreciation, financing, and tax.
Power budgeting. Racks running the Cortex sparse execution layer draw roughly 15–20% less power than dense workloads. When the same racks backfill traditional training or rendering jobs, draw returns to 100%. The utility contract and cooling plant are therefore budgeted for peak dense workloads, even though native MaaS traffic runs cooler.
Return on investment
Return depends on what the site costs to build, and that figure is not settled yet: it comes from the Mark III bill of materials for the eight racks and the compute fabric, plus the EPC quote for the power and cooling retrofit. Rather than assume a number, the model reports when Year 1 income recovers a range of capital costs.
Net of the $25.0M operating ceiling, Year 1 produces $559.2M of net operating income (Figure 16). A $150M build is recovered inside the second quarter of commercial operation; a $500M build is recovered inside the fourth.
Cumulative net operating income
Year 1 · USD · revenue less the operating cost ceiling
Table 5. Capital recovery sensitivity
| Capital cost | Payback quarter | Year 1 net ÷ capital cost |
|---|---|---|
| $50M | Q1 | 11.2× |
| $100M | Q2 | 5.6× |
| $150M | Q2 | 3.7× |
| $200M | Q3 | 2.8× |
| $300M | Q3 | 1.9× |
| $400M | Q4 | 1.4× |
| $500M | Q4 | 1.1× |
Payback is the first quarter in which cumulative net operating income exceeds the capital cost. Excludes financing costs, import duties, and tax.
Operations
Reflex hires locally, trains to a published standard, and certifies every technician before they work on live equipment.
Reflex will train and certify local crews
Training starts during construction so that certified crews are in place for rack delivery. Four tracks cover 44 seats in the first cohort, matching the Year 1 operating headcount.
Table 6. Certification tracks, first cohort
| Track | Scope | Levels | Weeks | Seats |
|---|---|---|---|---|
| Critical facilities technician | Switchgear, UPS, generator transfer, lock-out / tag-out | Level I–II | 12 | 16 |
| Liquid-cooling technician | CDU operation, coolant chemistry, leak detection, quick-disconnect service | Level I–II | 10 | 10 |
| Network & fibre technician | Structured cabling, InfiniBand and Ethernet fabric, OTDR testing | Level I–III | 14 | 10 |
| Cluster operations engineer | Cluster management, Slurm and Kubernetes, node triage, RMA workflow | Level II–III | 20 | 8 |
Certification has three levels. Level I technicians complete classroom and lab instruction, then work under supervision on de-energized equipment. Level II technicians work independently on live systems after a practical assessment by Reflex and Mark III engineers. Level III leads run shifts and train and assess Level I candidates.
Maintenance & depreciation
Maintenance runs on a fixed three-year calendar. Each row in Figure 17 is one activity, and a filled block marks every quarter it takes place. Facility systems are serviced every quarter, compute upgrades land in planned quarters to protect MaaS availability, and refresh planning begins in the fourth quarter of Year 2. The bottom row tracks hardware book value over the same period.
Hardware book value
Percent of capitalized cost · five-year straight-line
Job creation projections
Construction peaks at 180 direct workers. Operations begin with 44 direct roles and grow to 62 by Year 3 as MaaS volume and tenant count rise. Indirect and induced employment covers suppliers, security, logistics, and local services.
Projected jobs
Headcount by phase
Portfolio sites
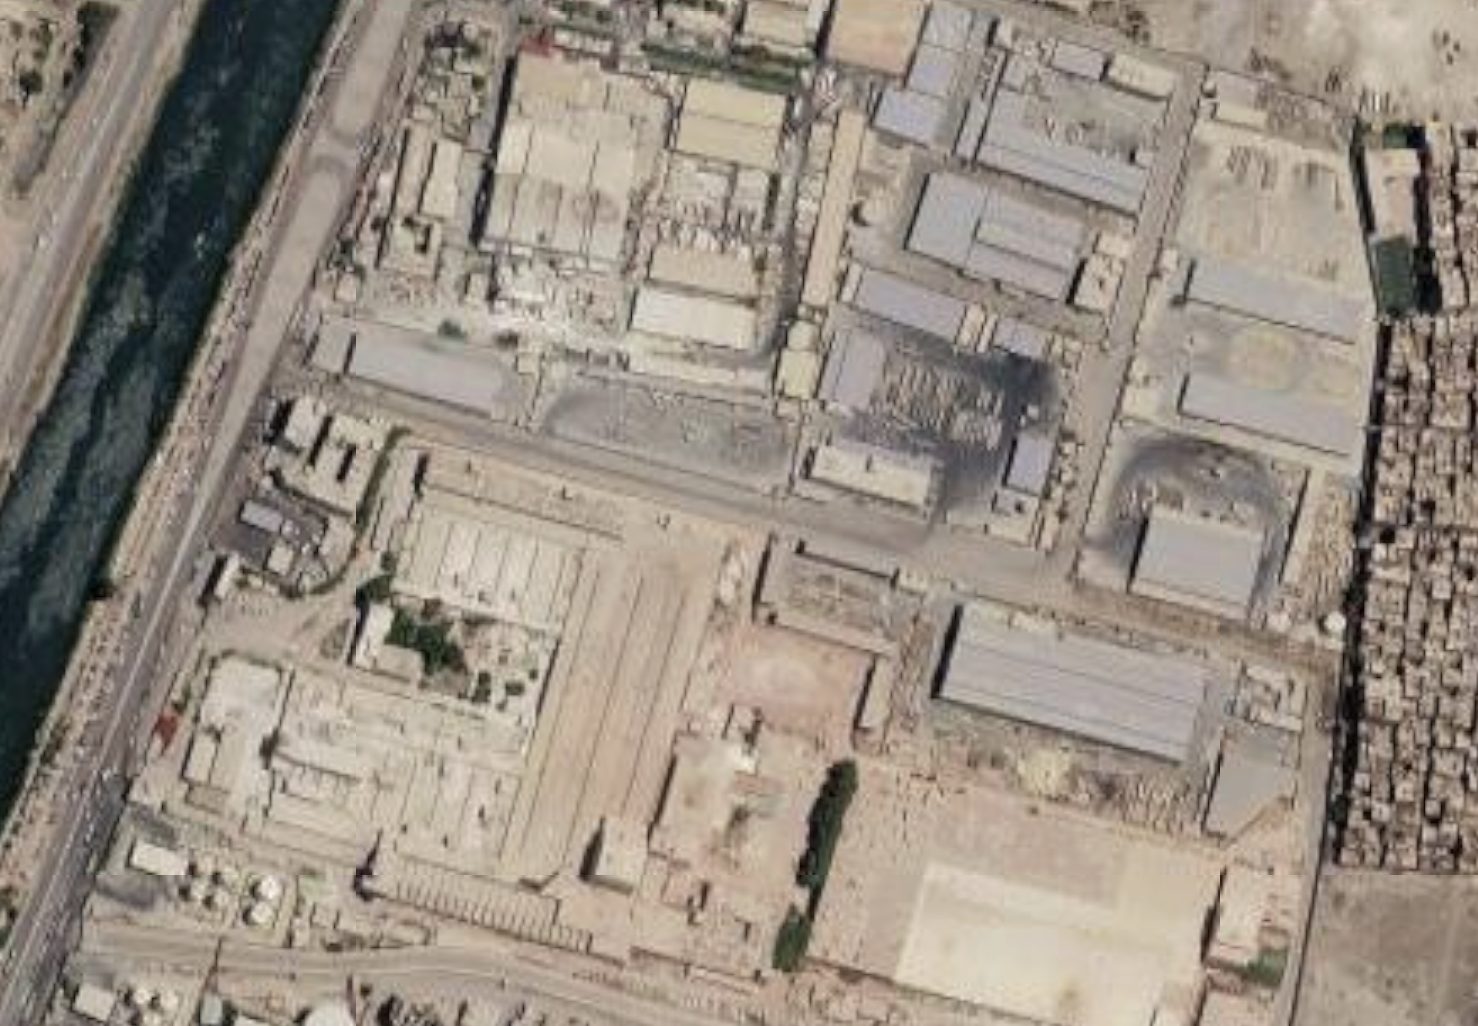
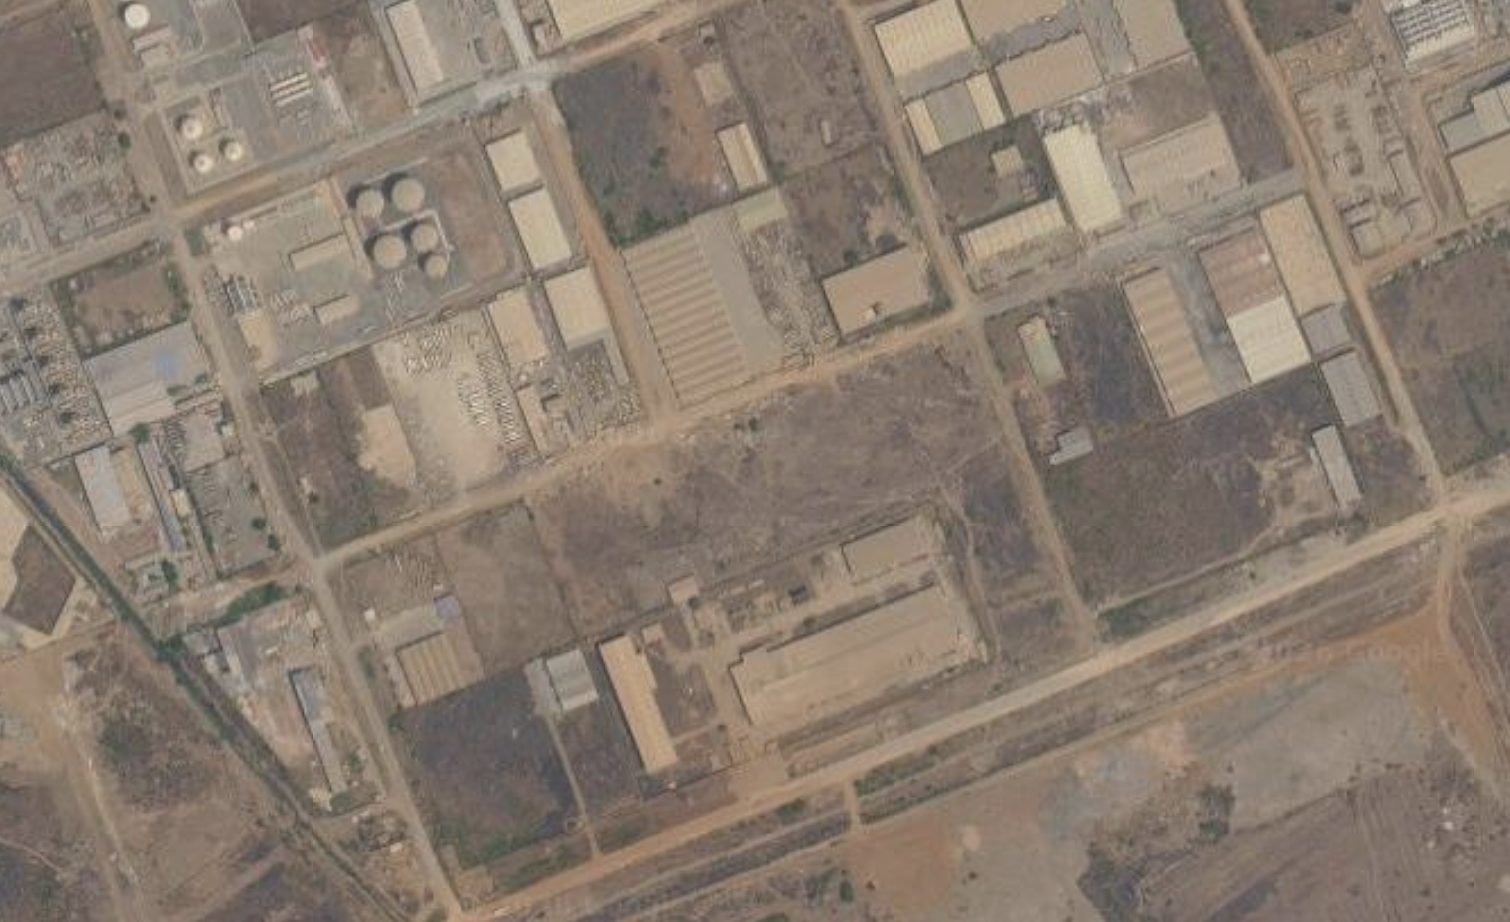
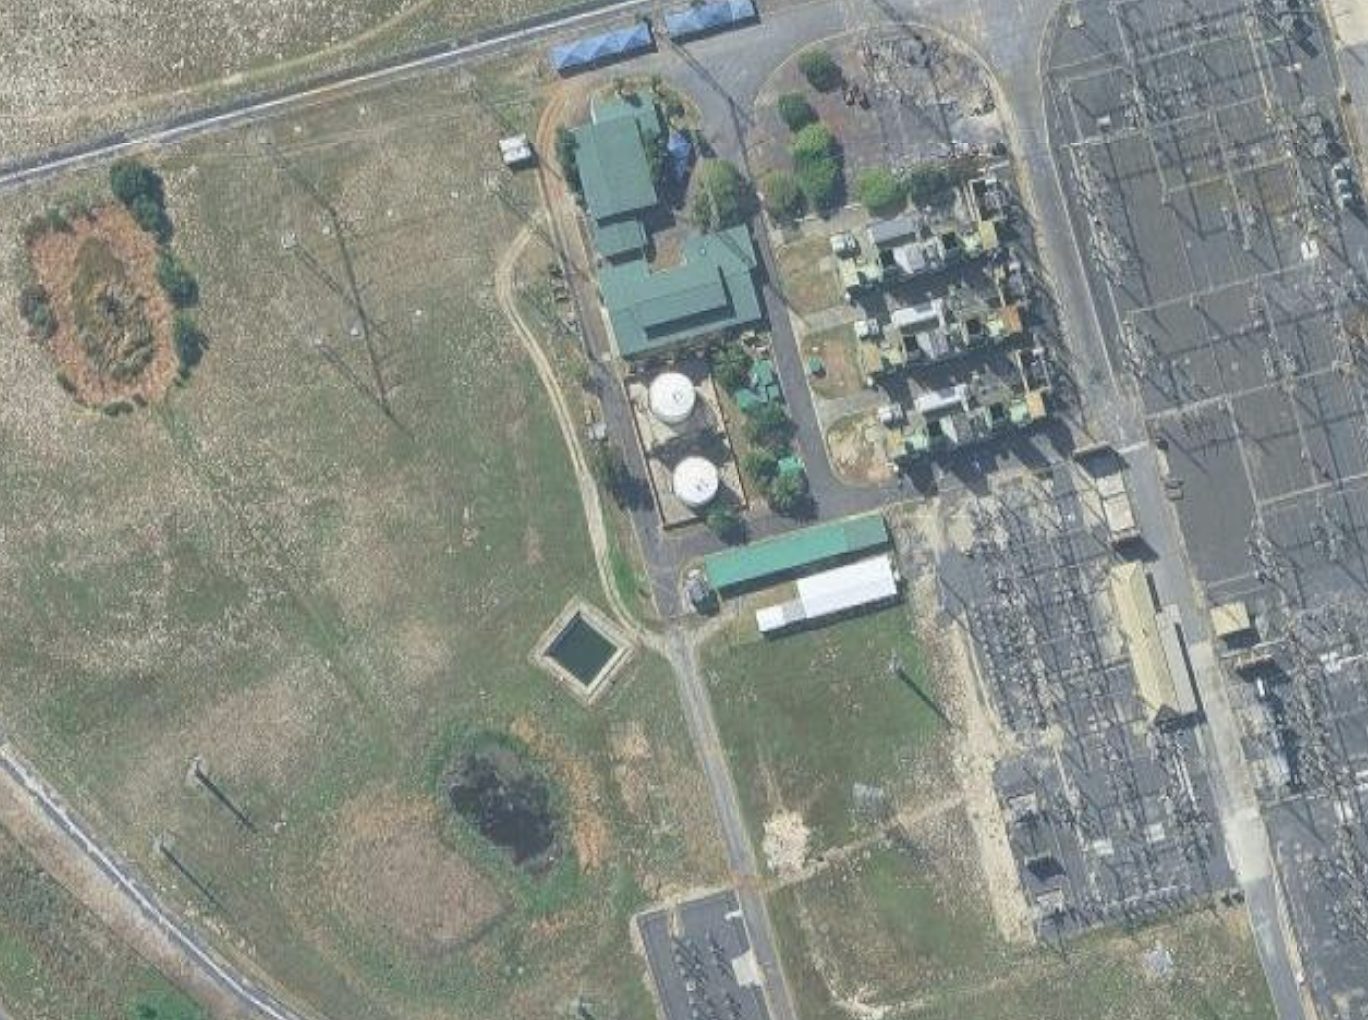
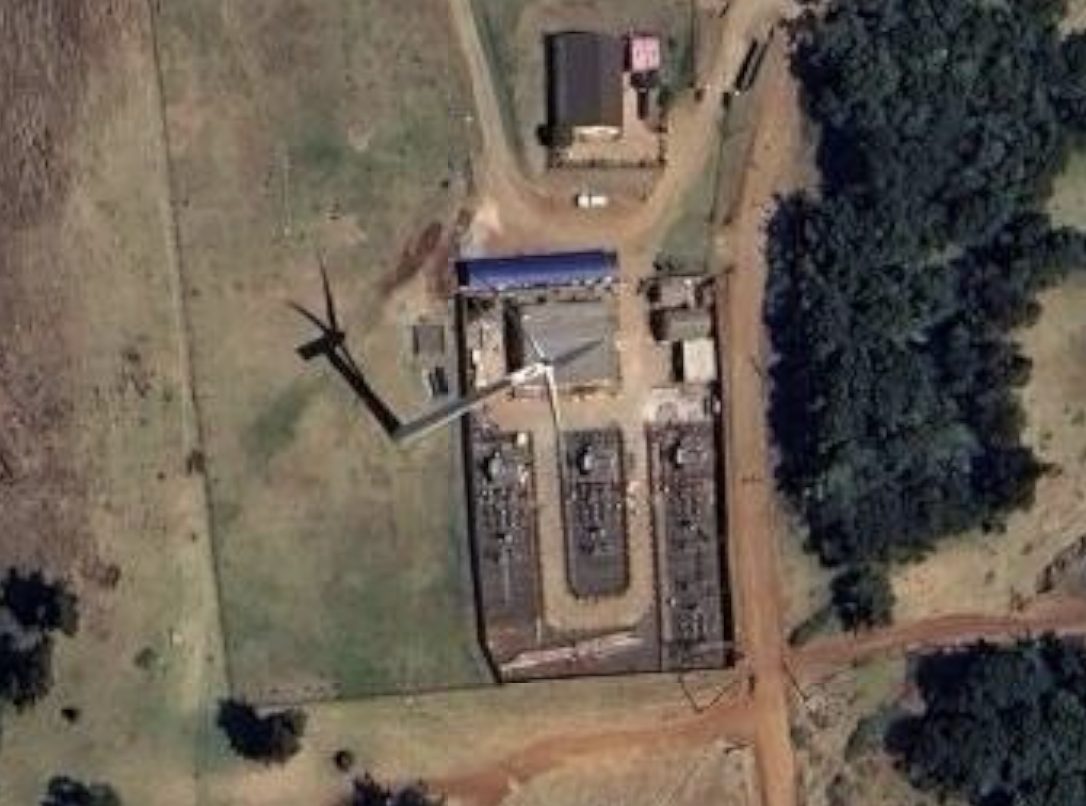
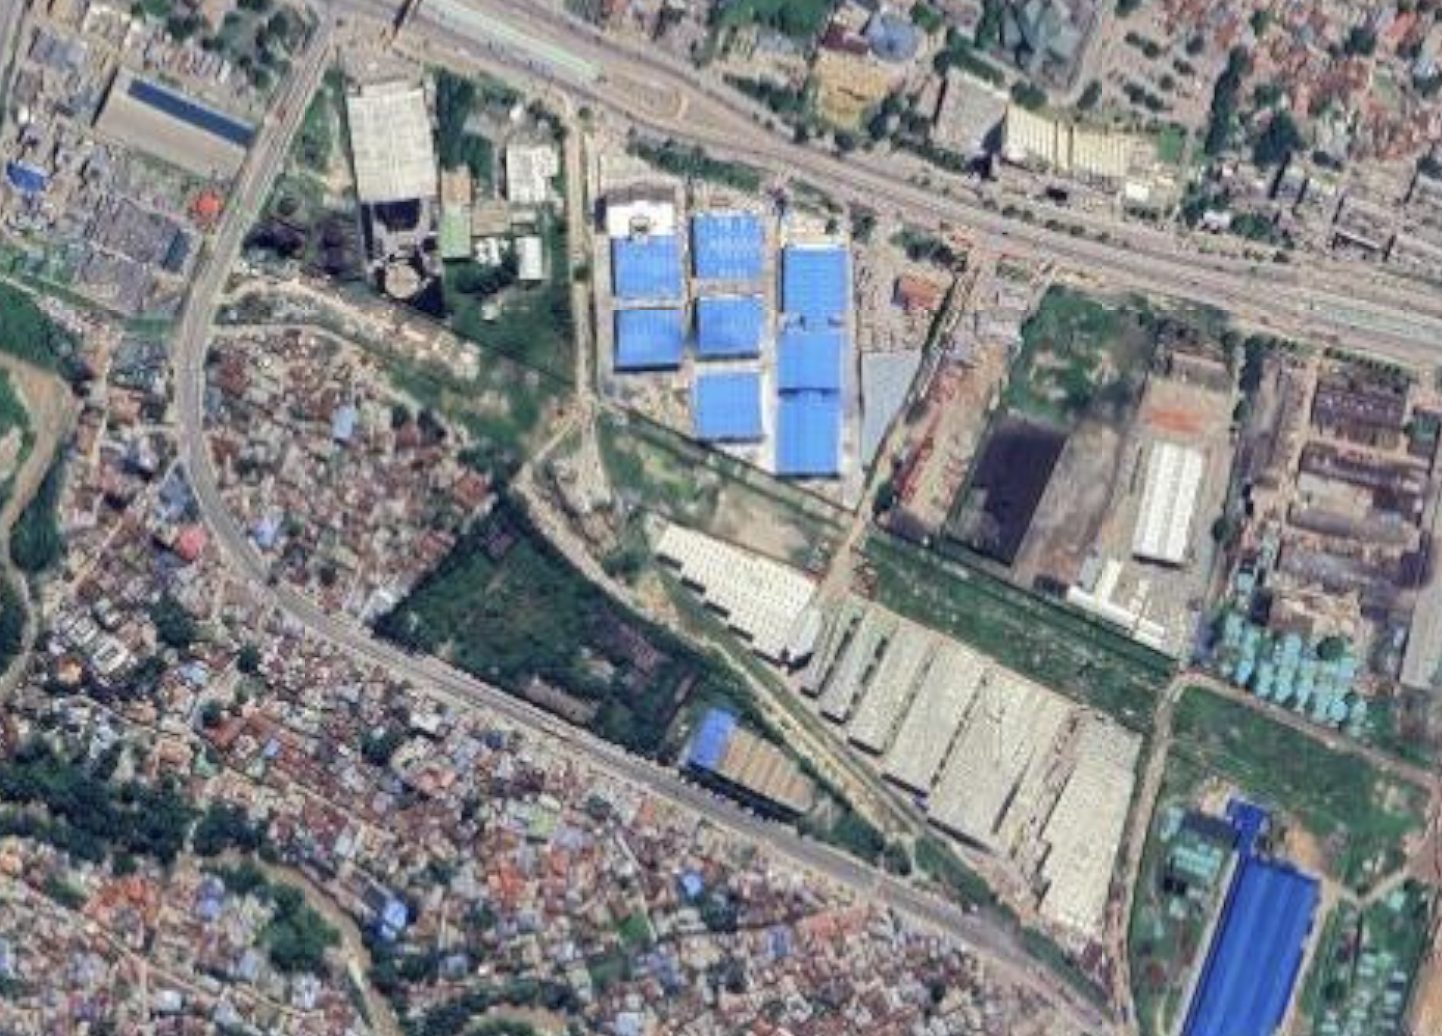
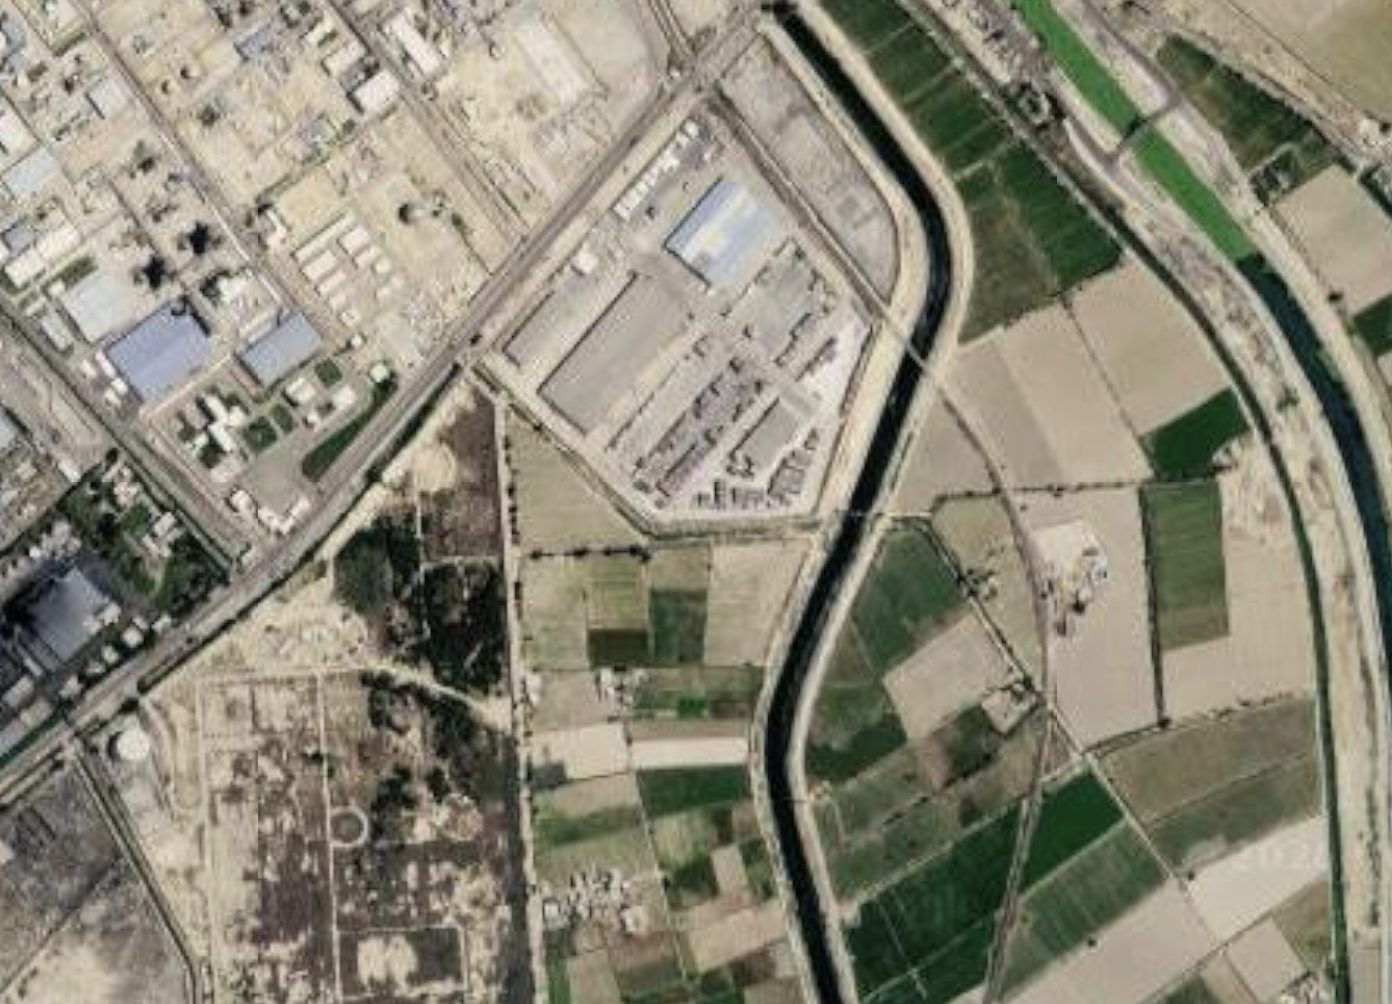
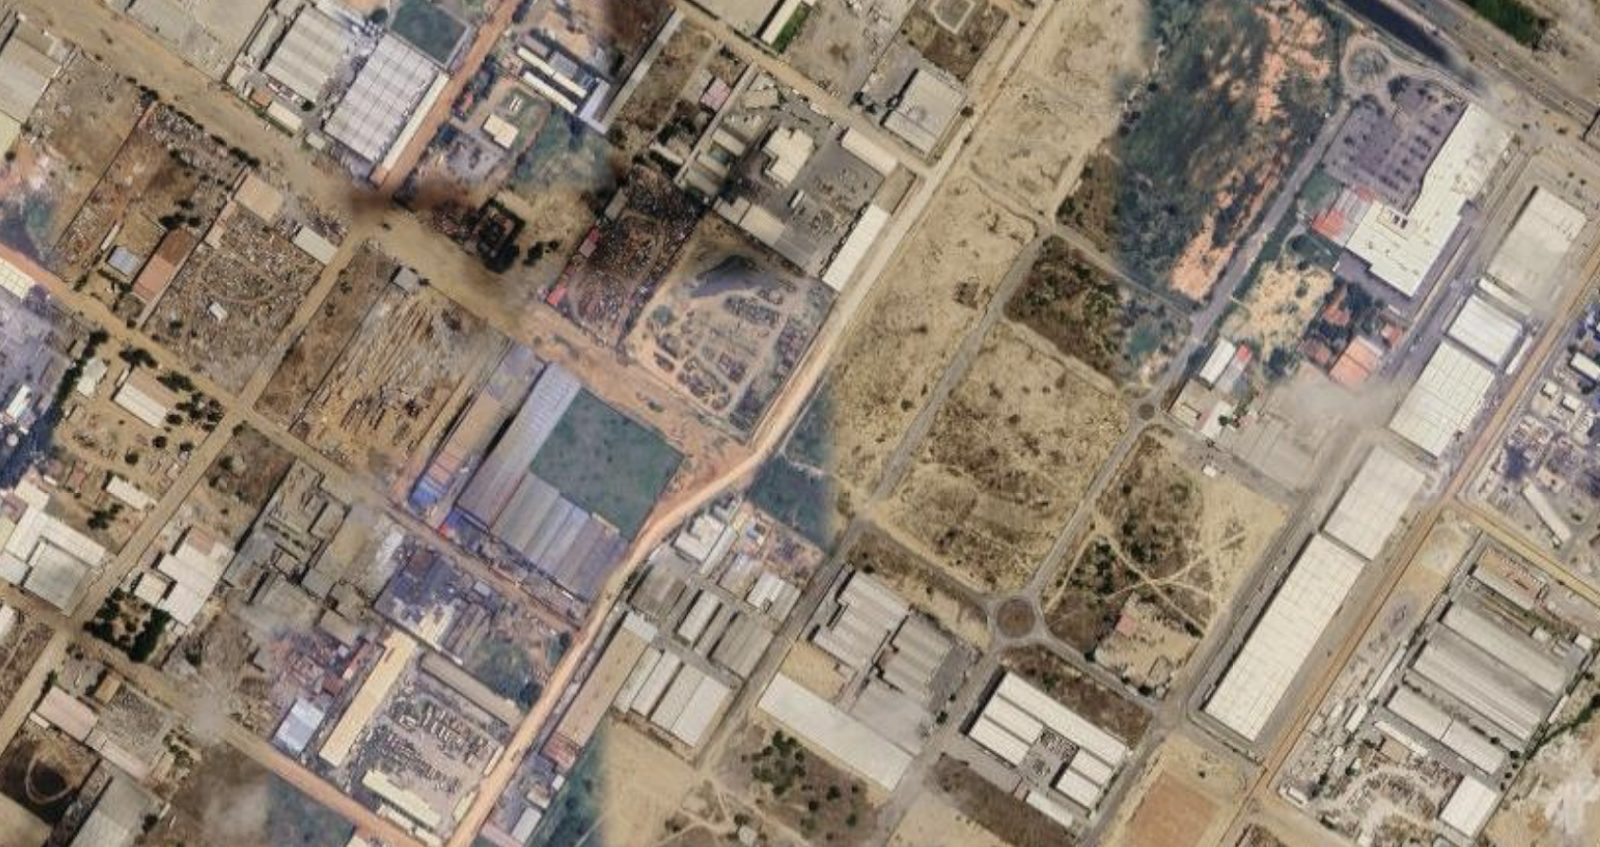
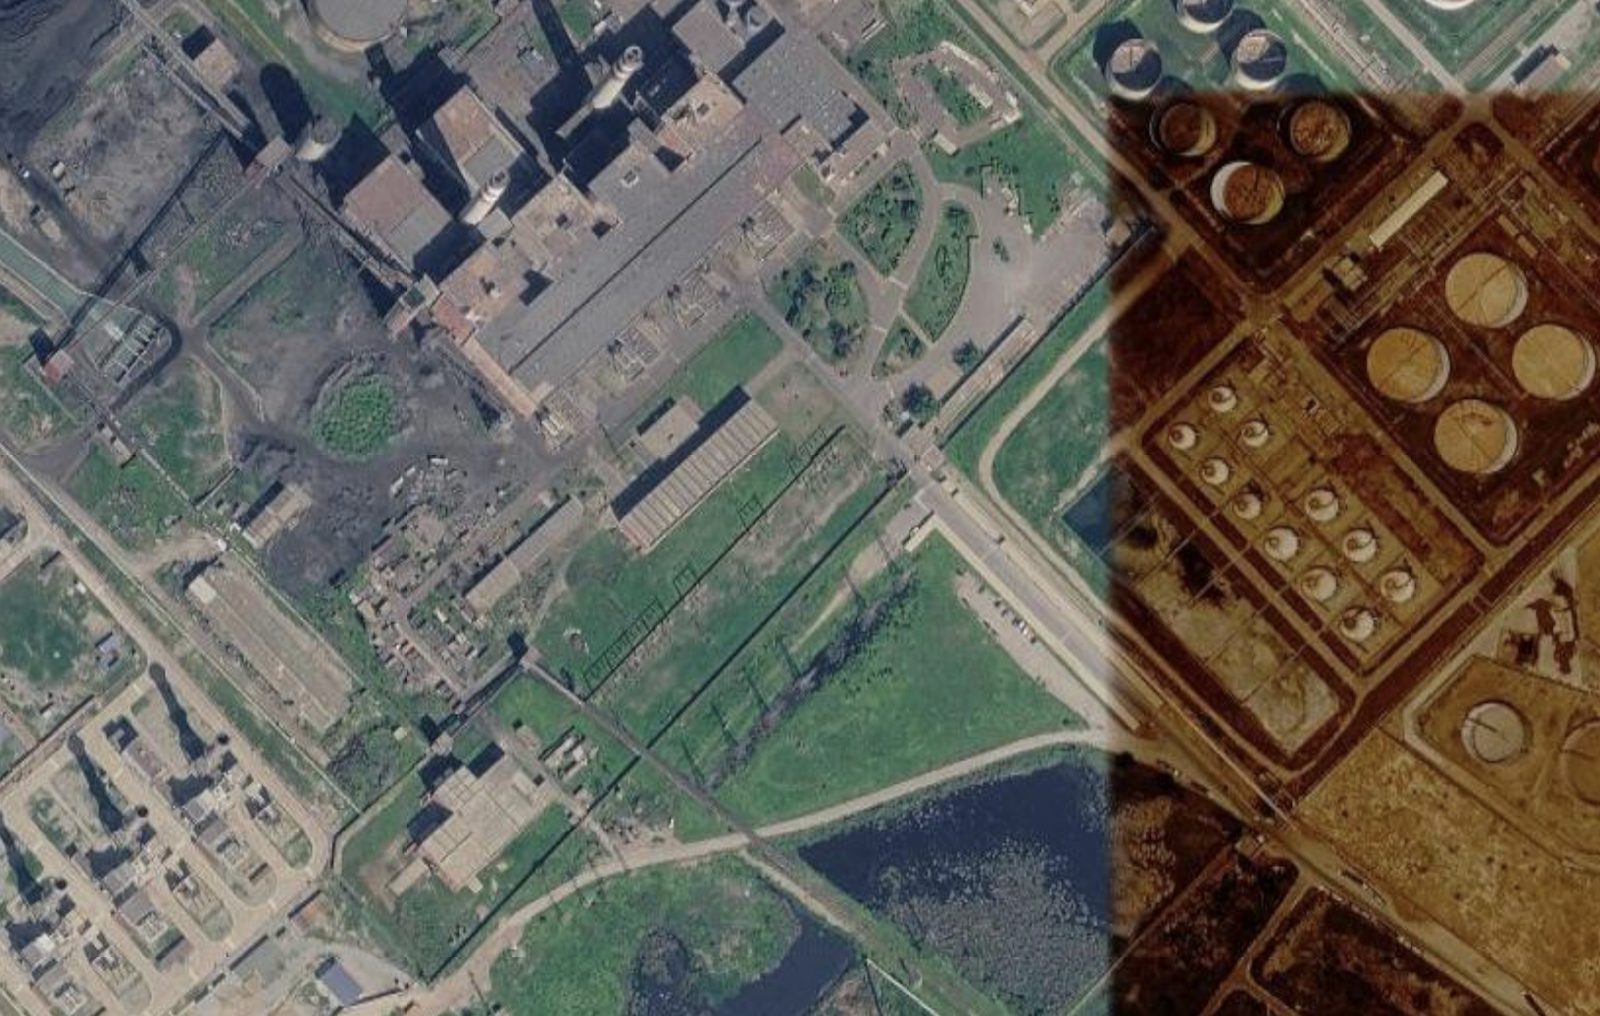
Lagos–Ogun is the first of ten. Each Cortex site reuses the same 2 MW module, the same Mark III integration playbook, and the same certification program.
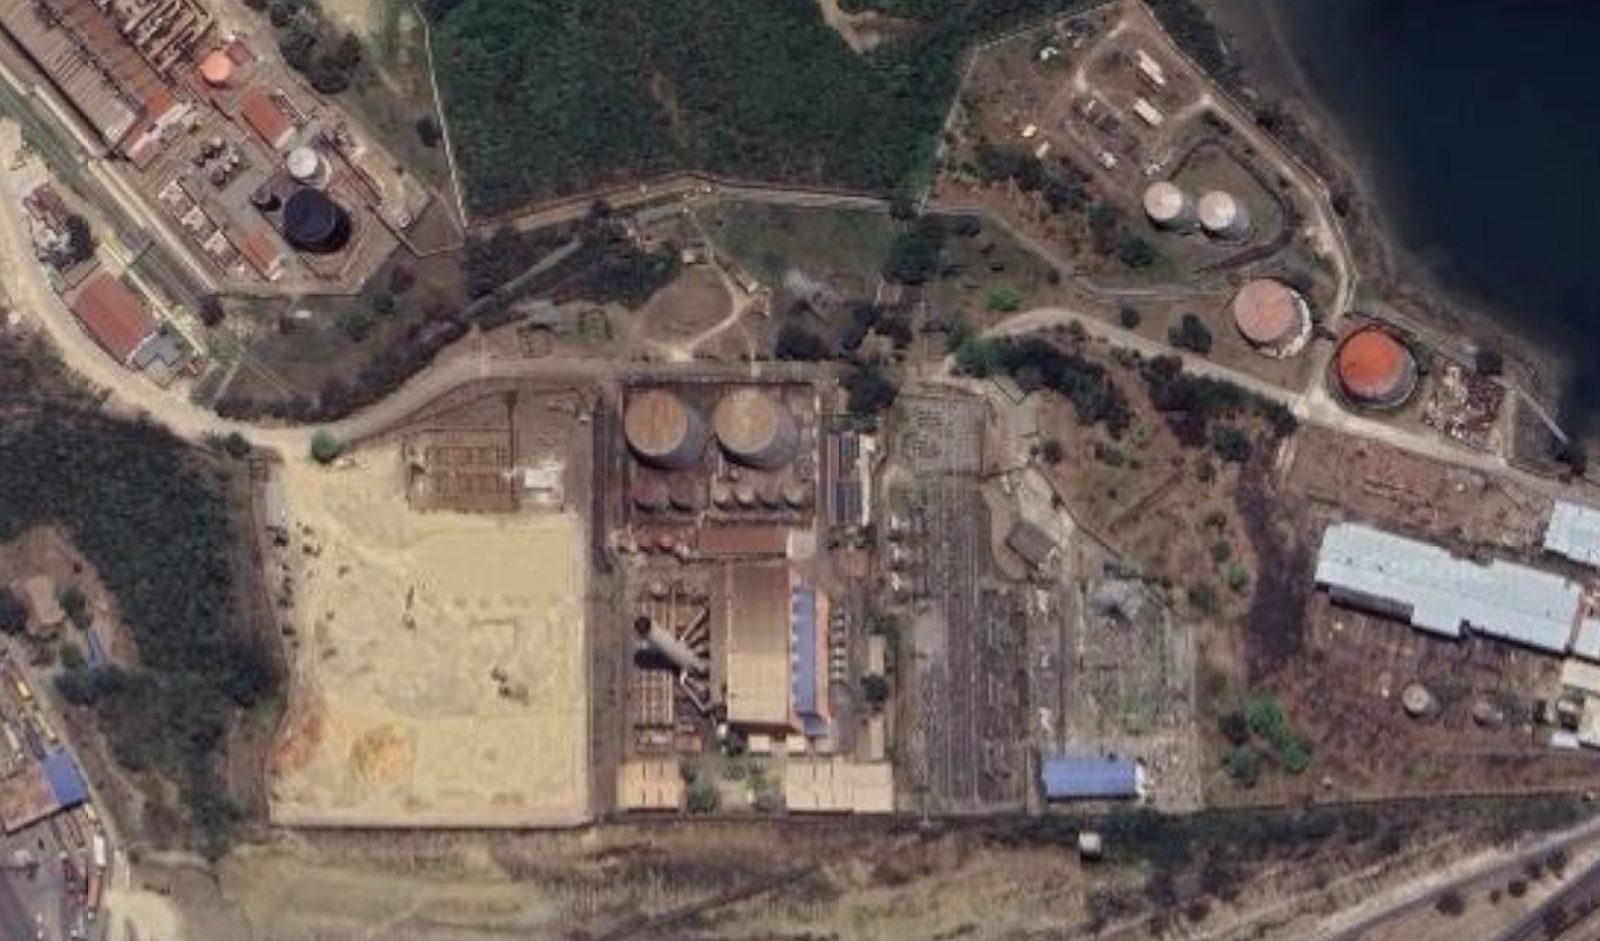
Customers
Cortex sells to three kinds of buyer: African enterprises that want inference close to their users, AI-native companies generating tokens at scale, and infrastructure firms that need power-available capacity.
Customer profiles
Table 7. Target customer segments
| Segment | Workloads | Token volume | Contract | Buying driver |
|---|---|---|---|---|
| Pan-African enterprises | Customer service agents, fraud scoring, document intelligence, local-language models | 50M – 2B tokens / day | MaaS, CCaaS | Data residency, latency to Lagos and Nairobi users, FX-predictable pricing |
| AI-native applications | Coding agents, search and answer engines, long-context reasoning | 1B – 50B+ tokens / day | MaaS | Cost per task on long-horizon workloads; throughput headroom |
| Inference & capacity offtakers | Overflow inference, fine-tuning, regional point of presence | Block capacity (GPU-months) | IaaS, dedicated lease | Power-available capacity outside saturated markets |
Target accounts
Enterprise demand concentrates in telecoms, banking, and payments across the target metros. AI-native demand comes from companies already processing millions of tokens a day that need a more efficient cost per task. Offtake demand comes from neoclouds and interconnection providers that sign multi-year inference and capacity agreements.
Enterprises in target metros
Telecoms, banks, payments, commerce, and industrials operating across the ten Cortex metros











- Andela
- Orange
AI-native applications
Products generating millions to billions of tokens per day, where cost per task sets margin


- Perplexity
- Cursor
- Mistral AI
- Hugging Face
- Replit
- Notion
- Intercom
- Duolingo
- Quora
Inference & capacity offtakers
Neoclouds and interconnection providers seeking power-available capacity outside saturated markets


- Lambda
- Together AI
- Nebius
- Crusoe
Track record
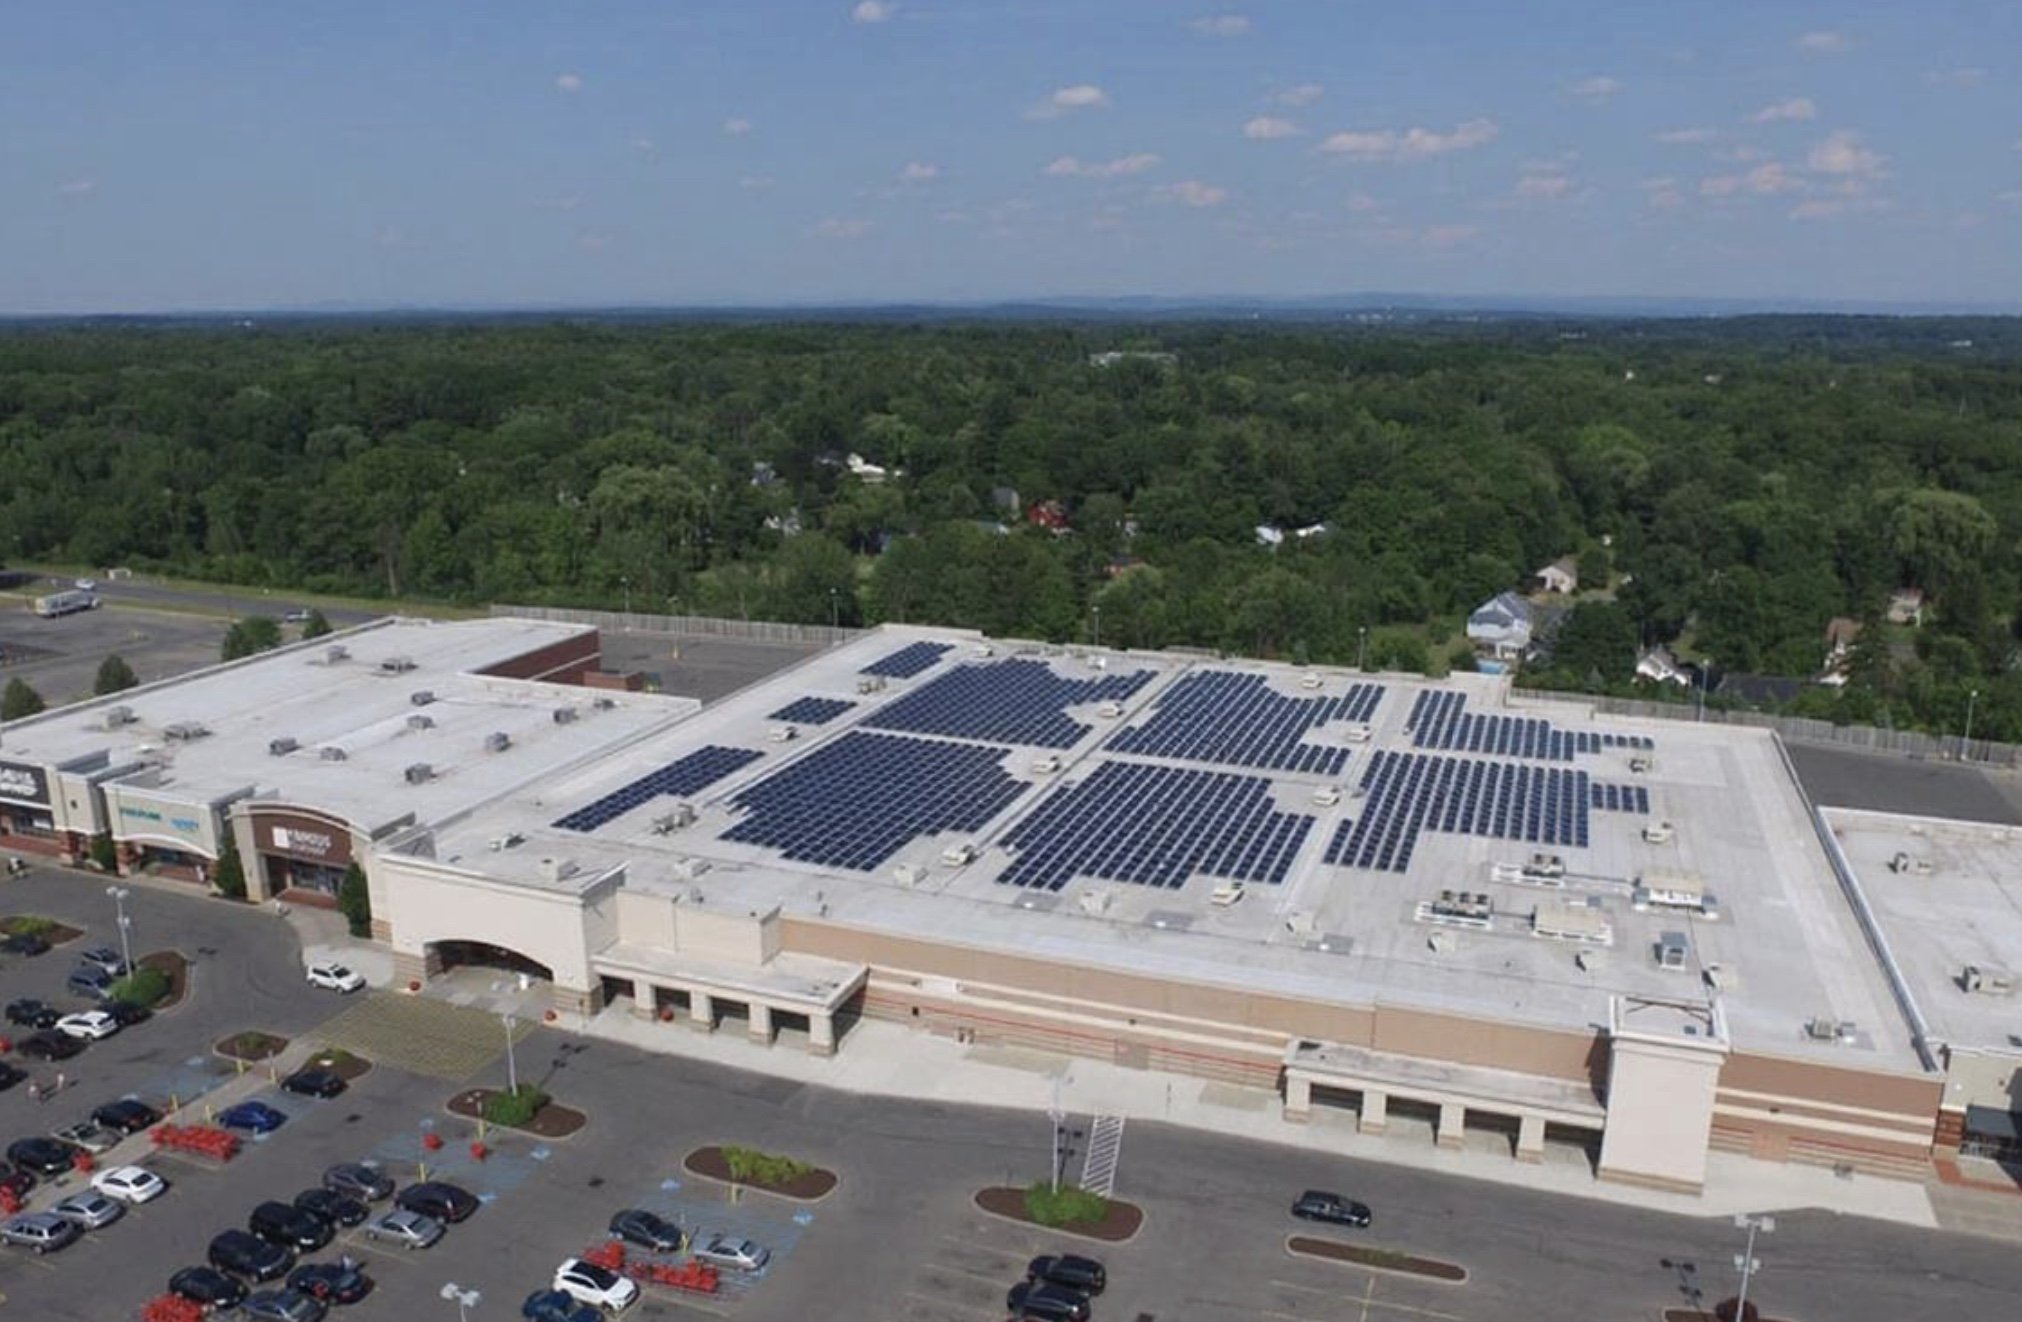
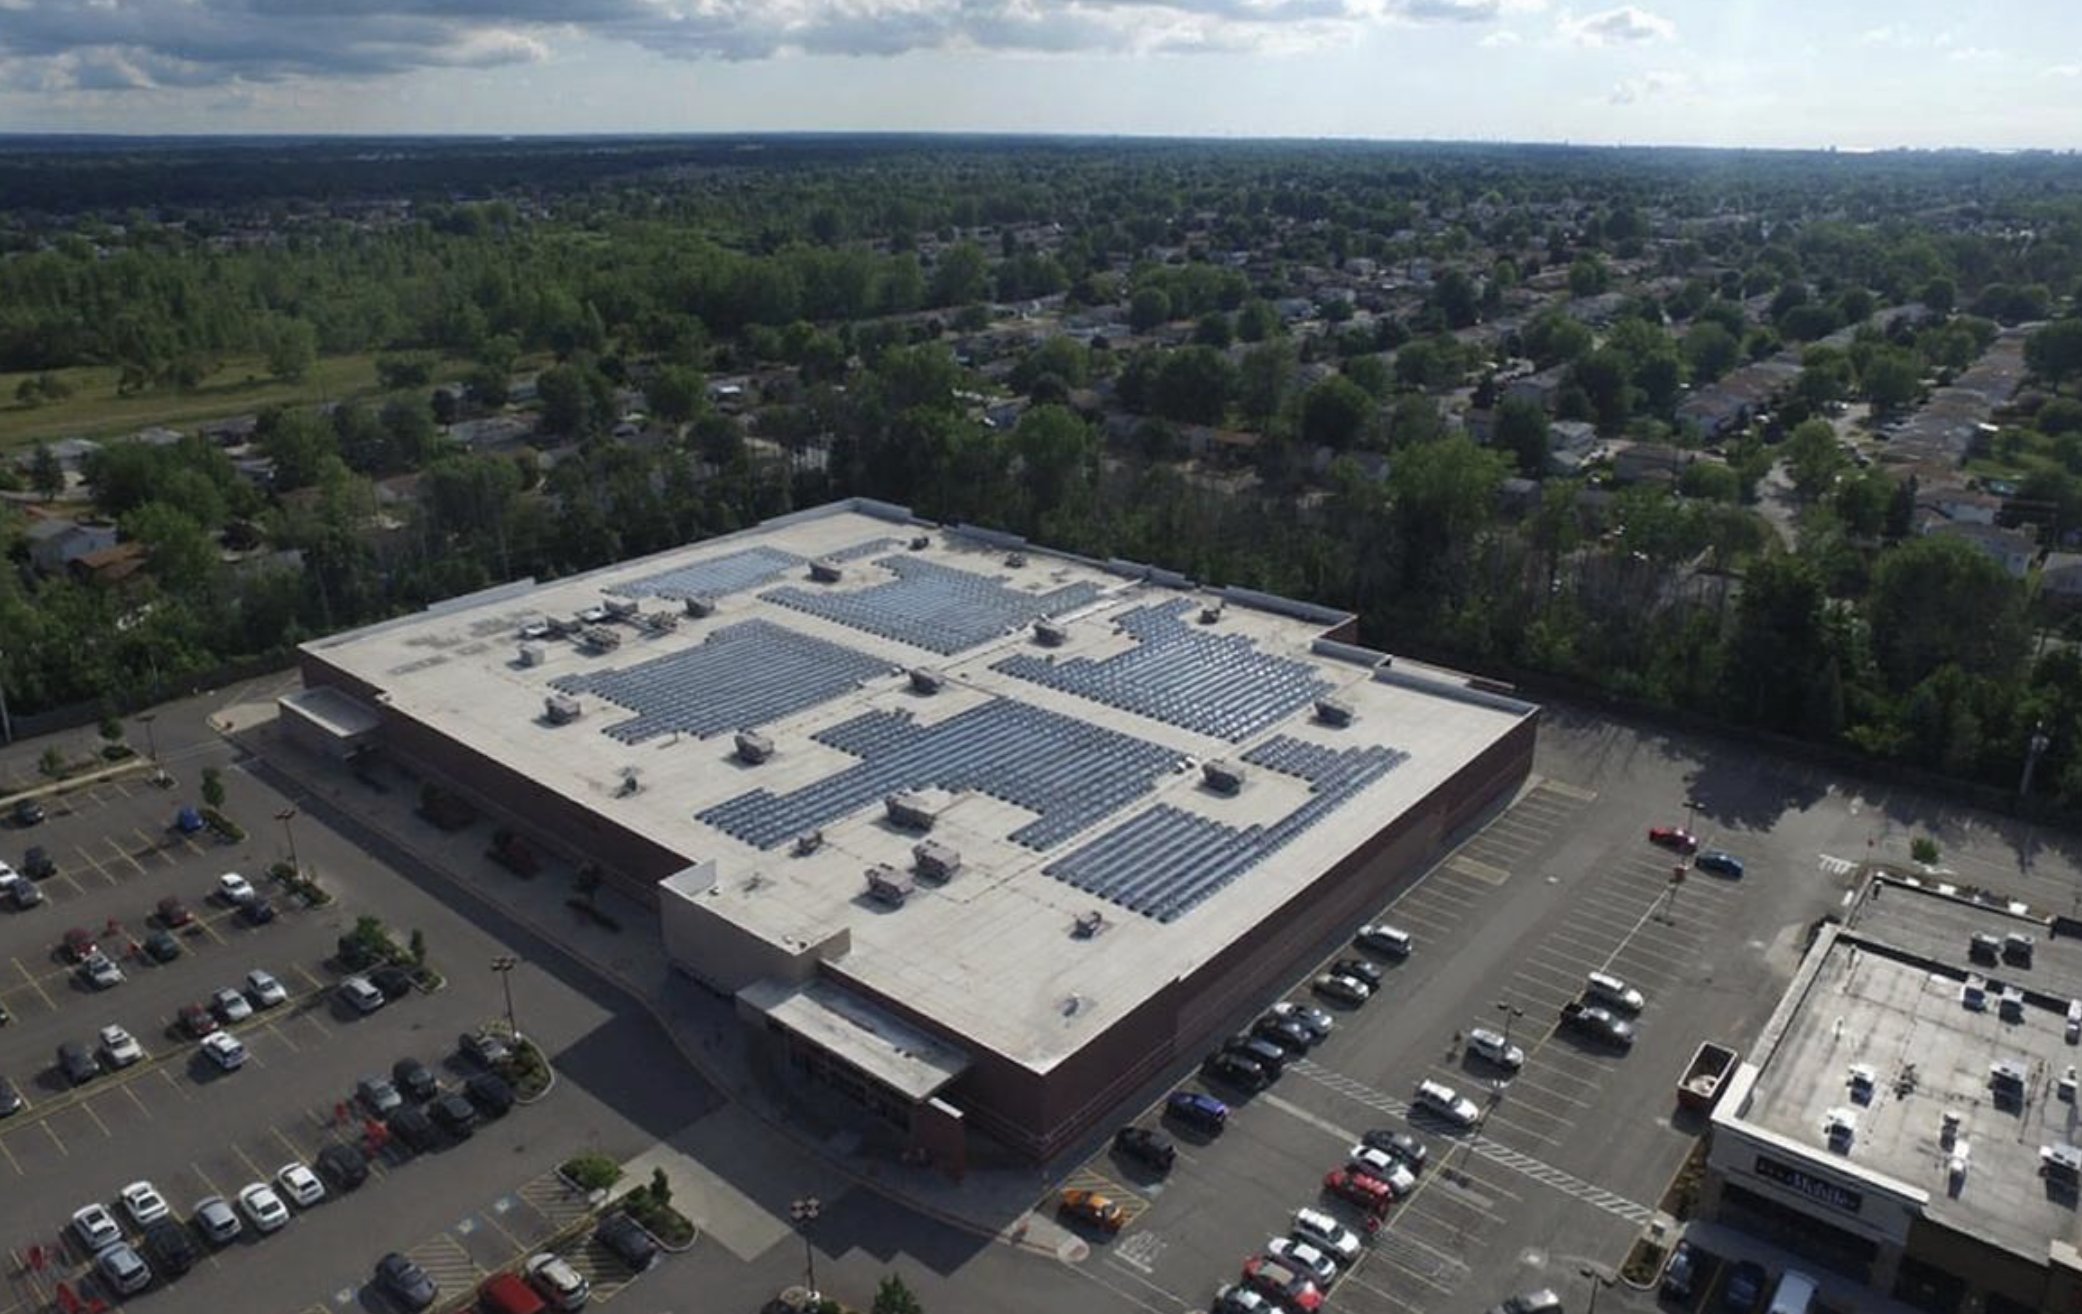
The Cortex delivery team has built rooftop solar arrays on two operating Target facilities in New York State, engineered around existing structures and connected to the utility without disrupting the tenant.
Notices & references
Forward-looking statements
This whitepaper contains projections of revenue, cost, employment, and schedule. They rest on assumptions about pricing, throughput, utilization, power availability, and regulatory approvals that may not hold. Actual results may differ materially. Nothing in this document is an offer to sell or a solicitation to buy any security.
Trademarks
NVIDIA, DGX, DGX SuperPOD, NVLink, and Vera Rubin are trademarks of NVIDIA Corporation. All other company names and logos are trademarks of their respective owners and are used for identification only.
Image credits
Continental satellite imagery: NASA Earth Observatory, Blue Marble Next Generation. Site satellite views: Google Maps. Warehouse photography: Private Property Nigeria listing. NVIDIA product imagery and diagrams: NVIDIA Corporation. Solar project photography: Reflex project records.
References
- NVIDIA DGX SuperPOD Reference Architecture: Rubin NVL8 (x86). docs.nvidia.com/dgx-superpod/reference-architecture/scalable-infrastructure-rubinx86/latest/abstract.html
- NVIDIA NVL72 AI Factory Enterprise Reference Architecture: Components. docs.nvidia.com/enterprise-reference-architectures/nvl72-ai-factory/latest/components.html
- NVIDIA DGX SuperPOD with DGX GB300 Reference Architecture. docs.nvidia.com/pdf/dgx-spod-gb300-ra.pdf
- NVIDIA DGX Vera Rubin NVL72 Datasheet. resources.nvidia.com/en-us-dgx-systems/dgx-vera-rubin-nvl72-datasheet
- NVIDIA Vera Rubin POD: Seven Chips, Five Rack-Scale Systems, One AI Supercomputer. developer.nvidia.com/blog/nvidia-vera-rubin-pod-seven-chips-five-rack-scale-systems-one-ai-supercomputer/
- NVIDIA DGX-Ready Managed Services. www.nvidia.com/en-us/data-center/dgx-ready-managed-services/
- NVIDIA Case Study: AI Accelerates Research Innovation at Bristol Myers Squibb. www.nvidia.com/en-us/case-studies/computational-science-accelerates-research-innovation-at-bristol-myers-squibb/
- Mark III Systems: The Enterprise AI Factory Partner. www.markiiisys.com/
- Private Property Nigeria: Warehouse for sale, Ota Industrial Estate. privateproperty.ng/listings/warehouse-for-sale-ota-industrial-estate-ado-odo-ota-ogun-9PBFDQ
- NASA Earth Observatory: Blue Marble Next Generation. earthobservatory.nasa.gov/features/BlueMarble