

Summary
Small manufacturers build hardware and run their operations on paper. Without instrumentation, the software they buy has no accurate data to work from, so it goes unused.
This paper defines three levels of shop-floor hardware, capture, integration, and edge intelligence, and what each one enables. Scheduling, capacity planning, and any model all depend on the system knowing what happened on the floor.
Key findings
- Capture is not optional. Keyed entry runs about one error per 300 characters; scanned entry runs about one per three million.
- Planning has hard input requirements. Capacity planning needs routings, live quantities, and process definitions. Without them, a shop cannot schedule.
- The US under-automates relative to its peers. At 307 robots per 10,000 manufacturing employees, the United States sits behind South Korea, Singapore, and Germany.
- Edge hardware is no longer the barrier. A module delivering 40 TOPS costs $249. The barrier is that most floors have no recorded data for a model to learn from.
Who builds in America
The shape of the market
Small firms account for 98% of US manufacturing firms, and roughly 75% employ fewer than twenty people. Manufacturers under 500 employees account for 4.8 million workers, about 40.9% of manufacturing employment. The federal MEP network reaches around 36,000 of them a year, and reports $24.6 of new sales for every federal dollar spent.
The automation gap
The United States installs fewer robots per manufacturing worker than South Korea, Singapore, or Germany.
Robots per 10,000 manufacturing employees
2024 · higher is more automated
Deloitte and The Manufacturing Institute project that manufacturing could need as many as 3.8 million new workers by 2033, with roughly 1.9 million of those roles going unfilled if nothing changes.
The maturity ladder
Three levels, adopted in order. Each level depends on the data produced by the one below it.
Level 1: Capture
Scanning stations at receiving, stock, production, and packing, with barcode or RFID tags on every item and every location. Handheld scanners cover moves away from a station; fixed RFID readers at dock doors and cell entrances record movement with no operator action. Operators need no login. They scan, and the system records what moved and when.
Barcode is cheaper per tag and needs line of sight. RFID costs more per tag and reads a full pallet at once, so it fits receiving and shipping, where material arrives in bulk.
Every read becomes an event with a time, a place, and a quantity. Stock by location and order status are calculated from those events, so they change the moment material moves. Figure 3 follows one pallet of pistons from the dock to a shipped order without a single typed entry.
- 13:48:05RFIDShipped OUT-1063Dock door 1 · 1 pallet tag read
- 13:15:22BarcodePacked OUT-1063Packing 1 · 24 × 750-10
- 11:02:51BarcodeCompleted WO-5521, 24 × 750-10Cell 3 · 24 pistons consumed
- 08:40:10HandheldPicked 24 pistons for WO-5521Cell 3 · from A-14
- 08:21:37HandheldPut away 48 pistonsStock A-14 · from receiving
- 08:14:02RFIDReceived PO-3318, pallet of 48 pistonsDock door 2 · 48 tags read
750 piston, on hand by location
- Receiving00
- Stock A-14024
- Cell 300
OUT-1063, status
- Open
- In production
- Built
- Packed
- Shipped
Level 2: Integration
Equipment reports for itself. Machine state arrives over MTConnect or OPC UA, scales and gauges post to the order they belong to, and run times are measured instead of estimated. Both standards have been public since 2008, and OPC UA is an IEC standard.
Utilization is measured, scrap is posted when it happens, and capacity reflects the machines on the floor.
Level 3: Edge intelligence
Inference runs at the line. Cameras count and inspect parts, models flag drift, and exceptions surface during the run instead of after it. The hardware is inexpensive: an NVIDIA Jetson Orin Nano delivers up to 40 TOPS at $249 within a 5–15 W envelope, and an AGX Orin module reaches 275 TOPS.
Table 1. Edge inference modules
| Module | AI performance | Power | Price |
|---|---|---|---|
| Jetson Orin Nano | 40 TOPS | 5–15 W | $249 |
| Jetson AGX Orin | 275 TOPS | 15–60 W | $3,499 (dev kit) |
Manufacturer-published specifications and pricing, accessed September 2026.
What each level buys
Accuracy of capture
Keyed entry and scanned entry differ by about four orders of magnitude in error rate.
Table 2. Error rates by capture method
| Method | Observed error rate |
|---|---|
| Manual keying | 1 error per 300 characters |
| Barcode scanning | 1 error per 3,000,000 characters |
Widely cited industry benchmark figures rather than a single named study; the relative magnitude, not the exact denominator, is the point.
In Zebra’s survey of 1,400 warehouse decision-makers, 32% reported using RFID, with a further 39% planning to adopt within a year.
RFID adoption
Percent of respondents
What planning requires
ASCM’s manufacturing planning and control framework separates priority planning from capacity planning, and capacity planning requires inventory data, master schedule data, and engineering and routing data, adjusted for scrap and rework.
A shop without Level 1 cannot supply those inputs reliably, which is why scheduling modules in ERP systems often sit unused.
Measuring the floor
Overall equipment effectiveness multiplies three numbers: how much of the scheduled time a machine was available, how fast it ran while available, and how much of what it made was good. A plant at 85% is considered world-class. Most discrete manufacturers run 55 to 65%, and only about 3 to 6% of plants reach the world-class mark.
A shop cannot compute any of the three without Level 2. Availability needs machine state, speed needs cycle counts, and quality needs scrap posted against the run that produced it.
Overall equipment effectiveness
Percent
These OEE ranges are industry benchmarks, not results from a single survey. A shop should measure its own line before setting a target.
Why shops stall at zero
Level 1 is inexpensive. Shops stall because software is sold assuming the data already exists.
A scheduling module assumes routings. An inventory module assumes counts. A quality module assumes recorded results. Without the stations that feed them, those modules ask for data nobody has, and the shop goes back to spreadsheets.
Reflex installs the stations first, as part of the system: fixed barcode and RFID readers where material already stops, labels printed by the system that reads them, and no operator login. Integration and edge intelligence follow on the same data model.
Smart manufacturing initiatives
Percent of respondents
Notices & references
On the figures
Where a number comes from a vendor survey or a widely repeated industry benchmark rather than an independent study, this paper says so on the page. Claims that could not be traced to a credible source, including the share of small manufacturers still working on paper, and generalized returns from machine-monitoring case studies, are omitted rather than estimated.
Trademarks
NVIDIA and Jetson are trademarks of NVIDIA Corporation. MTConnect is a trademark of the MTConnect Institute. OPC UA is a trademark of the OPC Foundation. All other marks belong to their owners.
Image credits
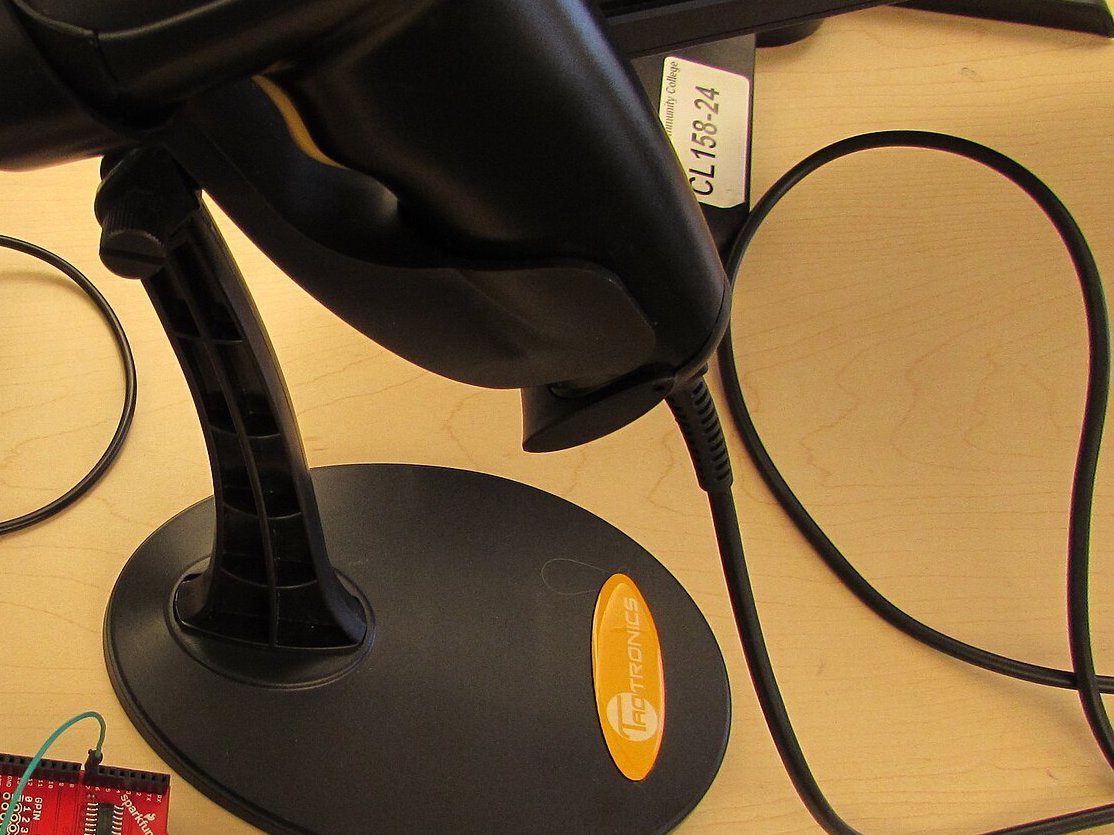
Cover: production line photograph by Бахтиёр Абдуллаев, CC BY-SA 3.0, via Wikimedia Commons. Capture hardware: photograph by 1sfoerster, CC BY-SA 4.0, via Wikimedia Commons.
References
- US SBA Office of Advocacy, Facts About Small Business: Manufacturing Statistics 2025 (March 2025). advocacy.sba.gov/2025/03/10/facts-about-small-business-manufacturing-statistics-2025/
- International Federation of Robotics, Robot Density Surges in Europe, Asia and the Americas (World Robotics 2025) (April 2026). ifr.org/ifr-press-releases/news/robot-density-surges-in-europe-asia-and-americas
- Deloitte & The Manufacturing Institute, Taking Charge: Manufacturers Support Growth with Active Workforce Strategies (April 2024). themanufacturinginstitute.org/manufacturers-need-as-many-as-3-8-million-new-employees-by-2033/
- Zebra Technologies, Warehousing Vision Study (1,400 decision-makers) (2023). www.rfidjournal.com/news/latest-warehouse-technology-study-sees-rfid-growth-ahead/200562/
- ASCM (formerly APICS), CPIM Learning System: Manufacturing Planning and Control (2020). learningsystem.ascm.org/wp-content/uploads/2019/11/CPIM_LS_2020_Excerpt-2.pdf
- MTConnect Institute, MTConnect Standard (since 2008). www.mtconnect.org/
- OPC Foundation, OPC Unified Architecture (IEC 62541) (since 2008). opcfoundation.org/
- NVIDIA, NVIDIA Jetson Orin (accessed September 2026). www.nvidia.com/en-us/autonomous-machines/embedded-systems/jetson-orin/
- Deloitte, 2025 Smart Manufacturing and Operations Survey (2025). www.deloitte.com/us/en/insights/industry/manufacturing/2025-smart-manufacturing-survey.html
- Senseye / Siemens, The True Cost of Downtime 2024 (2024). blog.siemens.com/2023/04/the-true-cost-of-downtime/
- NIST, MEP National Network (FY2023). www.nist.gov/mep/mep-national-network